ES short term trading 1-19-11
Without question the key zone to watch is 90.50 - 92 that includes pivot numbers, the breakout from yesterday late in the day, MP numbers, the close clusters, O/N low and last weeks highs
above that is 96 - 98 area...yd highs and R1 area...
what I'm leaning towards is selling try and target all those left over triples from yesterday ultimately but making sure we start taking something off in front of that key zone....so basically sells above 92 ...will watch volume and $tick as usual
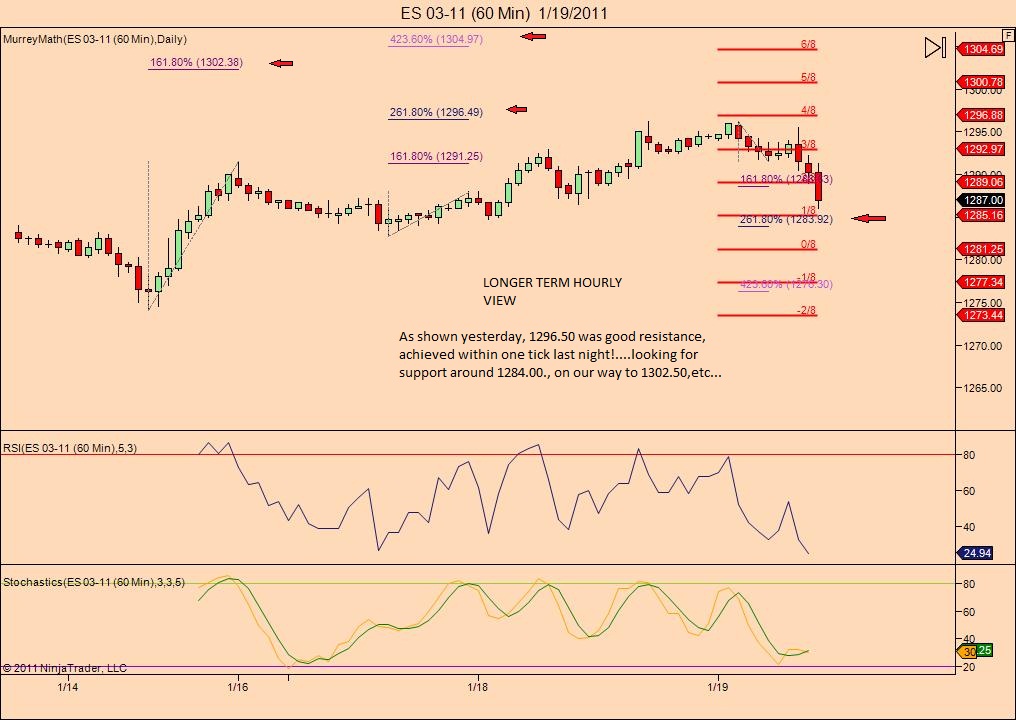
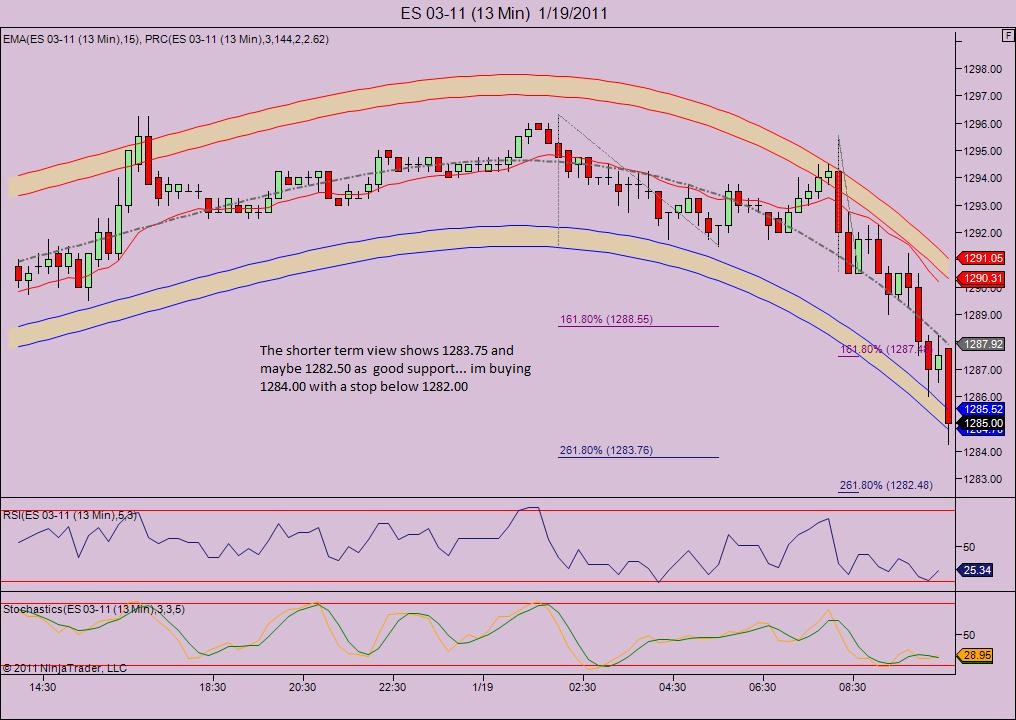
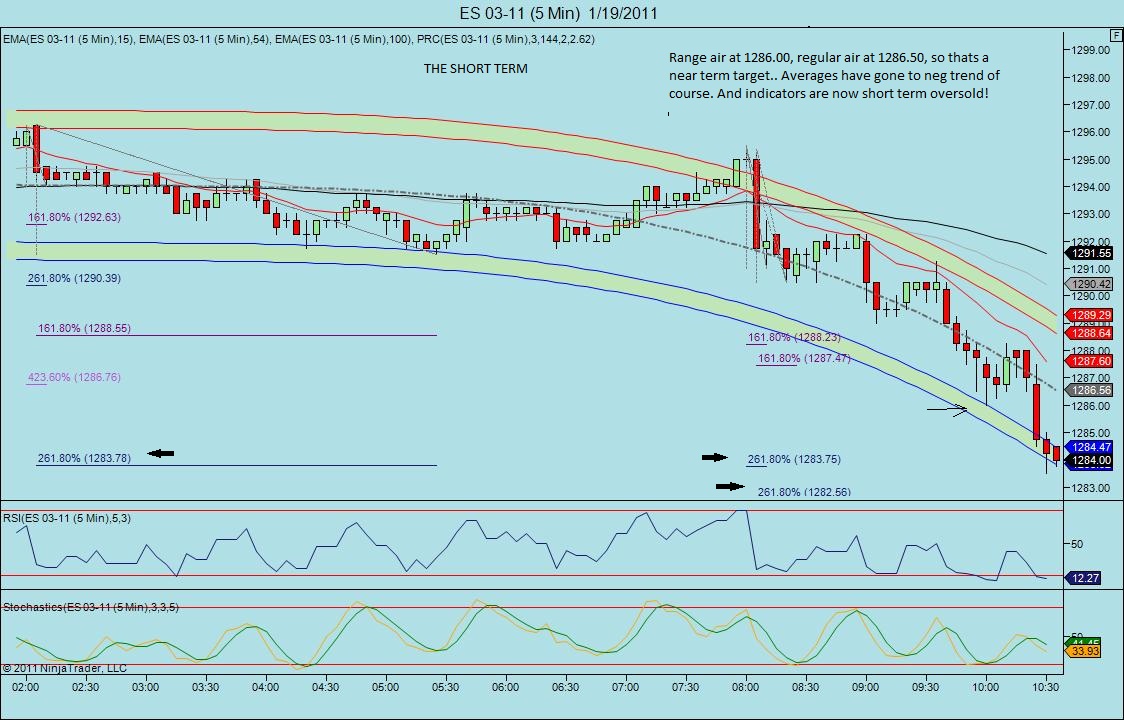
I see other area in confluence with your numbers 1287.25 as a support from a fib extension 1.618 Let's see what market will do...
Is 1292.00 is the half gap target?
ES is near Yesterday's L. 1282.75. I expect some testing here looking for support. Moving below I have support at 1279.75, below that 1274.50.
ES trading 1284.00 10:37
ES trading 1284.00 10:37
Notice that ES is zig-zagging as usual at a important support area, as it is yesterday's low.
If the ES was to move above 1285,75, then the PvP will be the objective.
Below, the failure point for the test as support (zig-zags room to oscillate) will be 1279.75 and will target 1274/1275 area.
ES trading 1283.50 @ 10:58
If the ES was to move above 1285,75, then the PvP will be the objective.
Below, the failure point for the test as support (zig-zags room to oscillate) will be 1279.75 and will target 1274/1275 area.
ES trading 1283.50 @ 10:58
Hi Kool. Been lurking here and there-just trading very partime. When you have time I was interested in knowing the following:
1) are you still trading crude oil?
2) your risk/reward ratio seems to be the opposite of what everyone else teaches. For example you often use a 3 point stop and exit at 1.75or 2 handles. On the other hand you seem to be succesful overall. Just wondering how you can be profitable in the long run with that type of risk/reward? Good trading!
can someone please explain what prep you are doing before the open to determine the directions of the day or trade? i see fibs, murray math and TPO charts. how are these being tied together in order to find the direction of the market? you can answer after todays trading , i know this will take a while to respiond to. thank you
Originally posted by toaksiethey're called polynomial regression cycle bands. I'd be happy to send it to you but it only works on ninjatrader.
How do you get the arching bands on your charts kool?
Emini Day Trading /
Daily Notes /
Forecast /
Economic Events /
Search /
Terms and Conditions /
Disclaimer /
Books /
Online Books /
Site Map /
Contact /
Privacy Policy /
Links /
About /
Day Trading Forum /
Investment Calculators /
Pivot Point Calculator /
Market Profile Generator /
Fibonacci Calculator /
Mailing List /
Advertise Here /
Articles /
Financial Terms /
Brokers /
Software /
Holidays /
Stock Split Calendar /
Mortgage Calculator /
Donate
Copyright © 2004-2023, MyPivots. All rights reserved.
Copyright © 2004-2023, MyPivots. All rights reserved.


