Weekend Prep Work
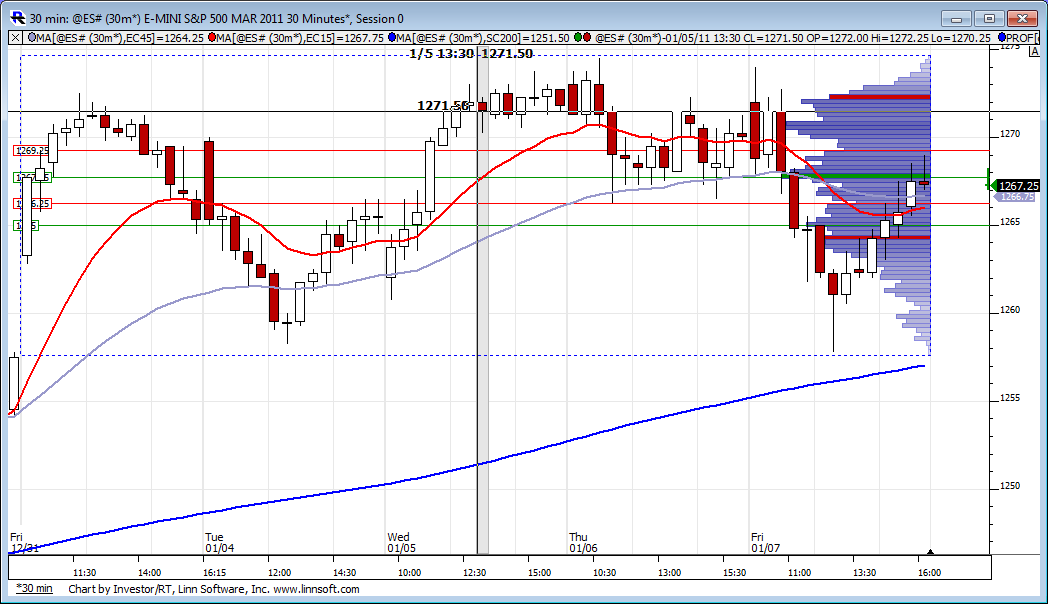
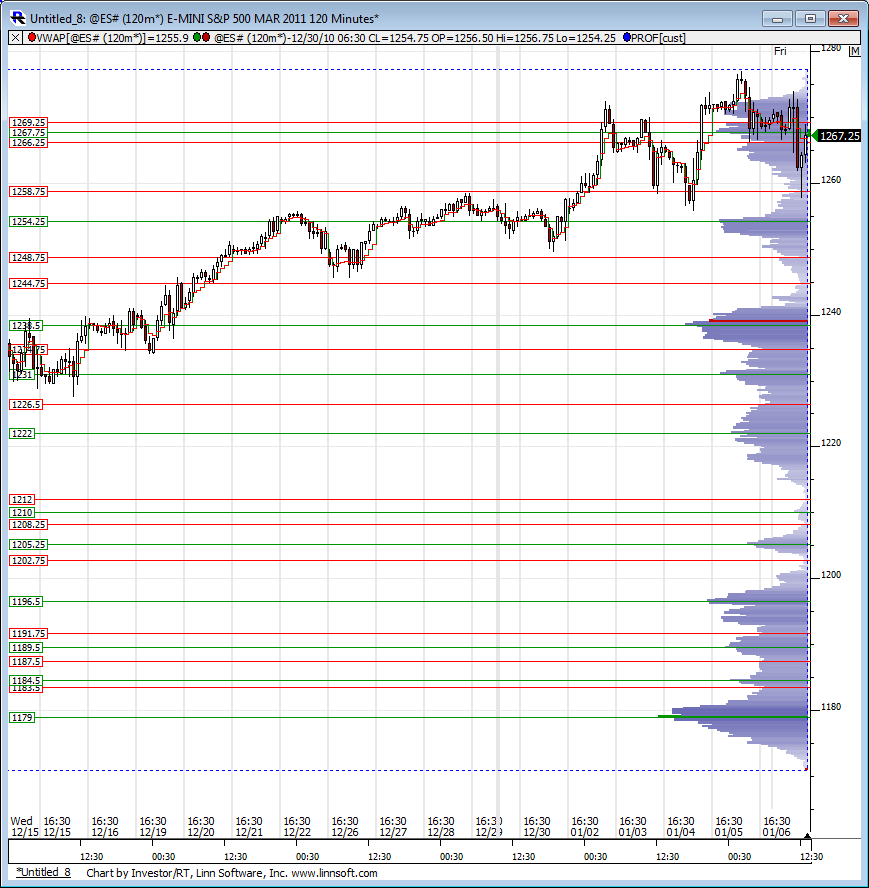
Here is the profile for the rise beginning November 16th to the present. I realize this covers two different contracts but the volume numbers still mean something and give zones of support/resistance to keep note of.
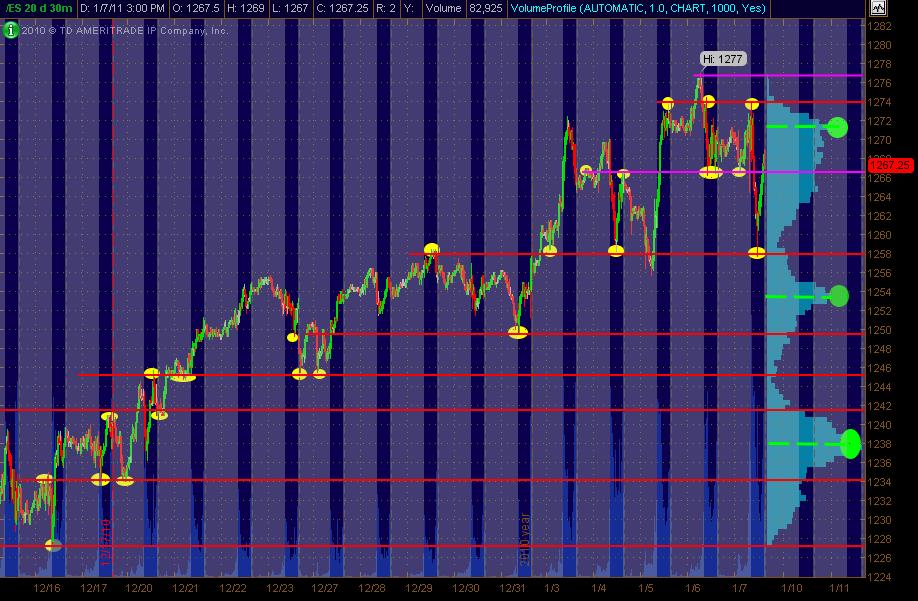
Nice "goods" from Lorn as usual! Thought I'd post my ES 30m PASR chart (all trading hours), with the Blue areas being RTH and the Gray areas being "overnight sessions." I'm still giving more weight to the RTH sessions for "finding" the best looking PASR levels ... yet also incorporating the overnight sessions in gray into the mix.
As a side note: this shows how much goes on outside of the RTH sessions (lots of gray area when ya take it all in visually) ... and there's an area that is rife for exploration/researching ... to potentially trade the night session or to uncover how it can affect the following RTH session.
The Red lines are potential significant S/R levels with Magenta as semi-significant. I've drawn in with YELLOW OVALS on past price areas to show how/where I've derived the price S/R levels for additional info. Also, the vertical Blue Volume Profile on the right side of the chart reflects 20 days of all-hours trading activity. I've circled and drawn in with dashed lines in Green the High Volume Nodes (zones).
This is a "map" for coming into Monday's trading ... and can/should be combined with Lorn's work and others that post. Don't forget the Daily and Weekly Pivot levels as confluence (not drawn in on this particular chart) Hope this is of use and helpful!
Went thru about 1000 equity daily charts so far ... and some are "extended" during the past 2-3 days but many are consolidating at or near their highs ... which to me shows some bullish strength still left fwiw (we'll probably drop 200 SP points now that I've pointed that out)
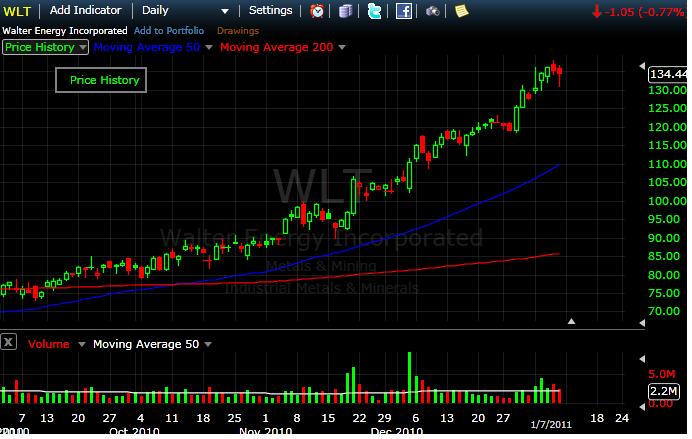
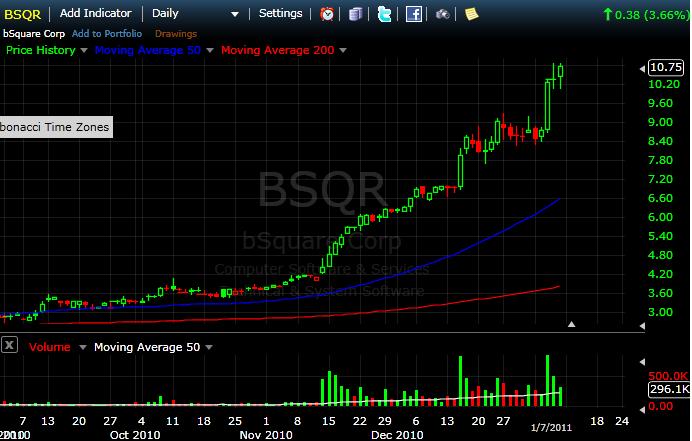
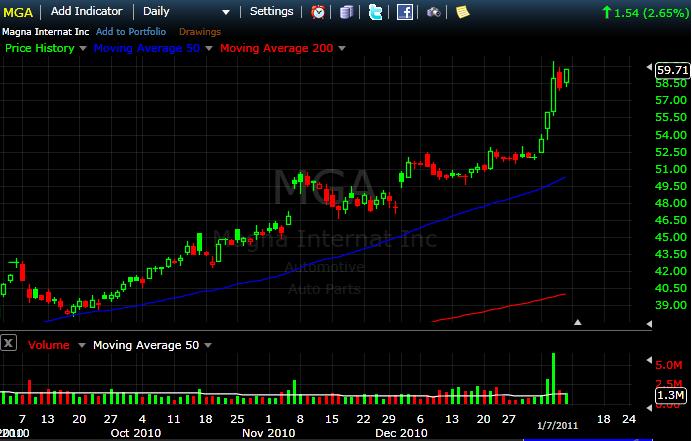
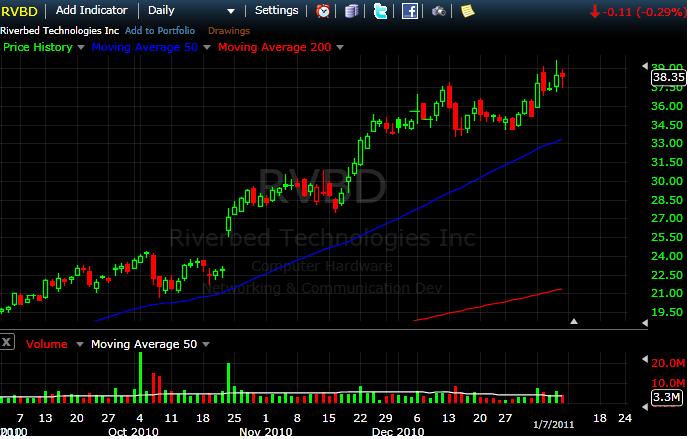
Here's a short list of potential long STOCK plays IF the market continues UP (a couple are low price, low volume ... so be careful):
RVBD
WLT
BSQR (high risk, may need a day or few pullback/consolidation)
MGA
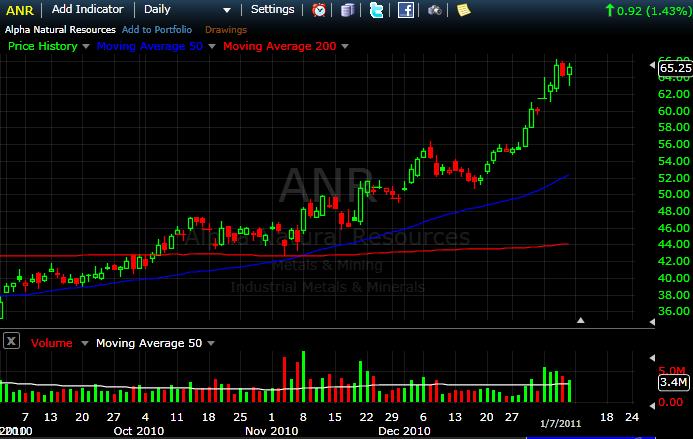
ANR
Take 'em with a grain (or a shaker) of salt
Here's a short list of potential long STOCK plays IF the market continues UP (a couple are low price, low volume ... so be careful):
RVBD
WLT
BSQR (high risk, may need a day or few pullback/consolidation)
MGA
ANR
Take 'em with a grain (or a shaker) of salt
Thought I'd go ahead and post the stock charts I'd listed above. You'll see a couple are kinda overextended, but could be a 1 or 2 day play ... while the others have a consolidation of multiple days to work with. These are only to be played long if the market moves UP!! Here they be:
Higher risk! May be better to put on a "watchlist" for pullback or consolidation that sets up well for another run to the upside.
Originally posted by MonkeyMeat
Another one kind of extended but may be worth a pop up Monday ... and if not, is worthy of keeping an eye on for a "setup" that may unfold during the next few days to week+.
Its extremely useful to do what MM is doing here. Looking at individual stocks gives added perspective to whats going on in the markets. After all, the ES is an "equity index" product.
Emini Day Trading /
Daily Notes /
Forecast /
Economic Events /
Search /
Terms and Conditions /
Disclaimer /
Books /
Online Books /
Site Map /
Contact /
Privacy Policy /
Links /
About /
Day Trading Forum /
Investment Calculators /
Pivot Point Calculator /
Market Profile Generator /
Fibonacci Calculator /
Mailing List /
Advertise Here /
Articles /
Financial Terms /
Brokers /
Software /
Holidays /
Stock Split Calendar /
Mortgage Calculator /
Donate
Copyright © 2004-2023, MyPivots. All rights reserved.
Copyright © 2004-2023, MyPivots. All rights reserved.
