ES Short Term Trading 12-01-2010
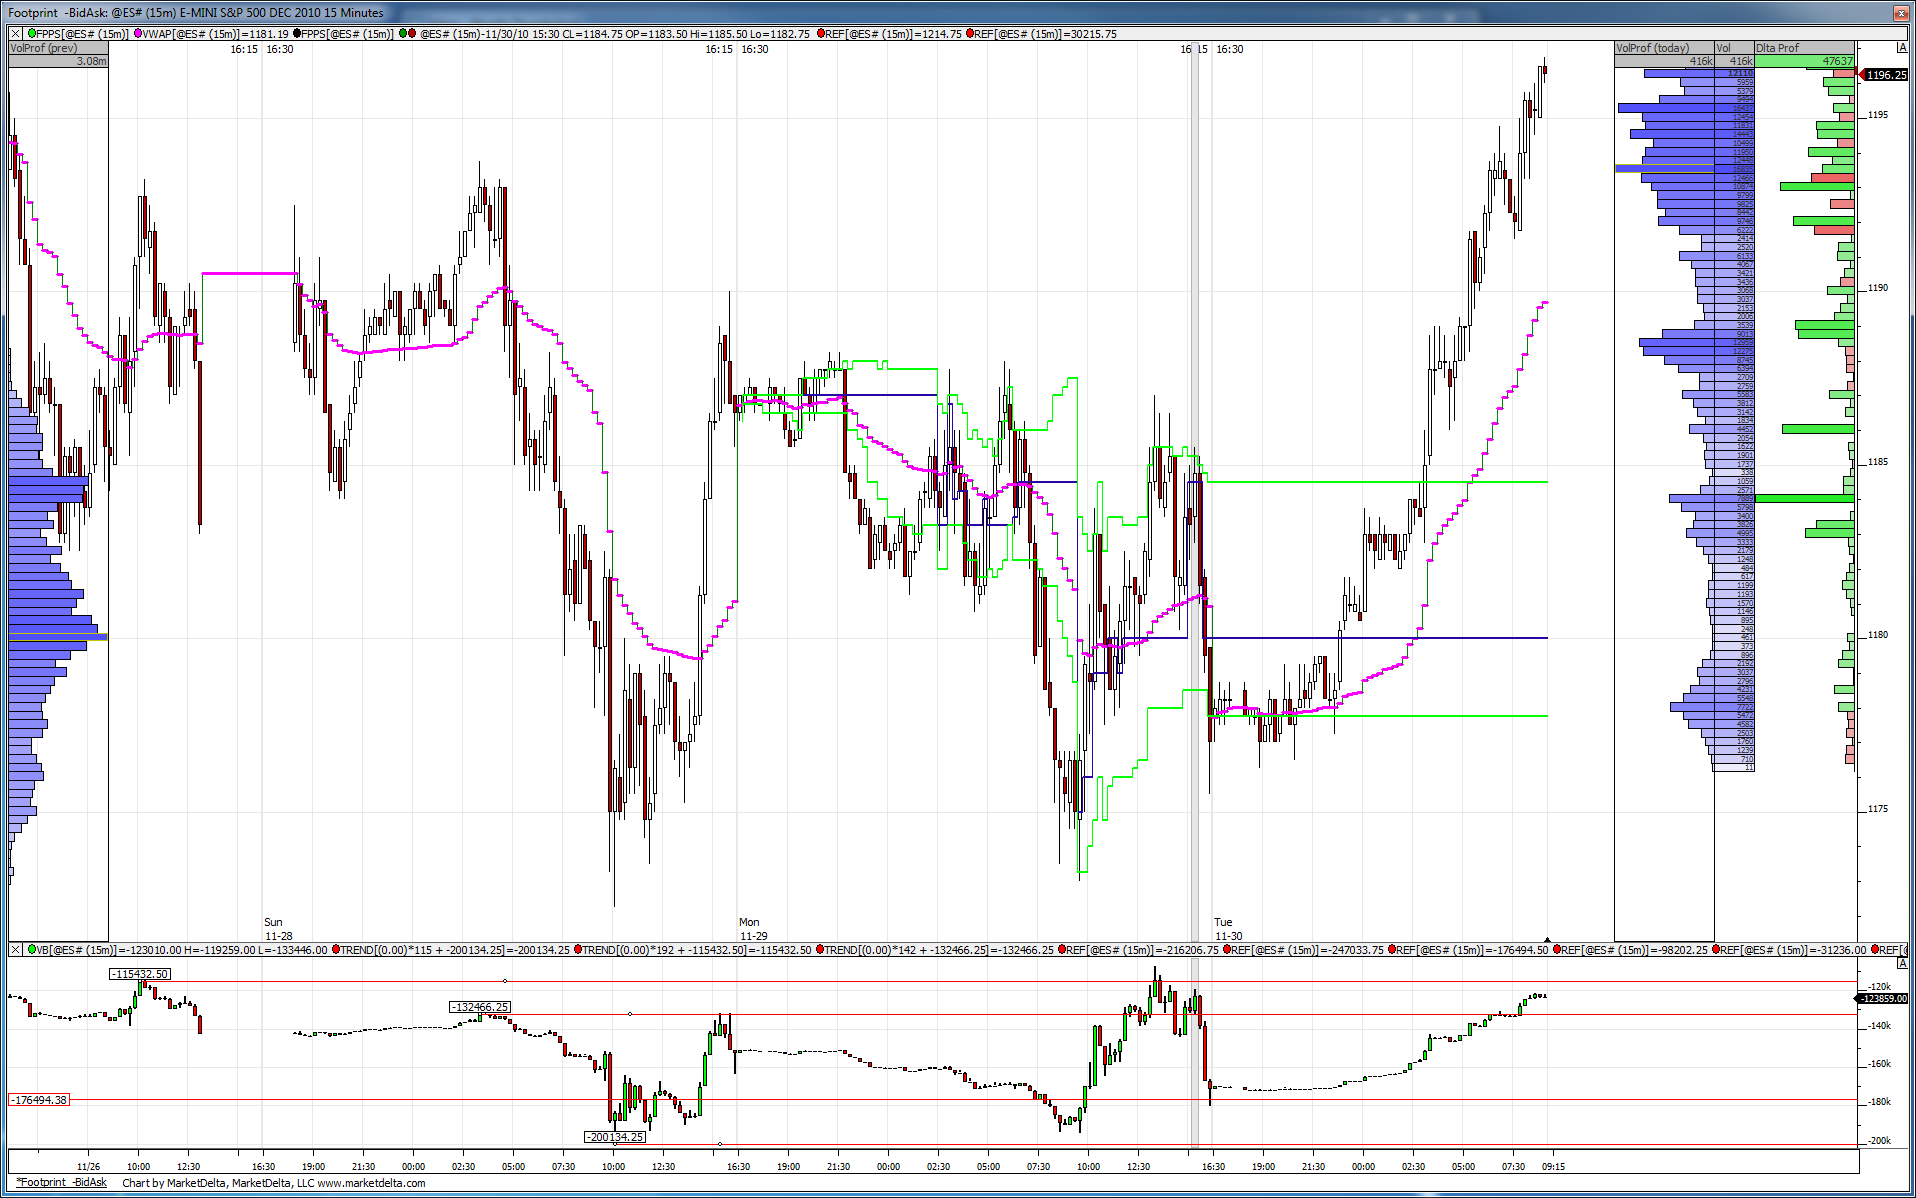
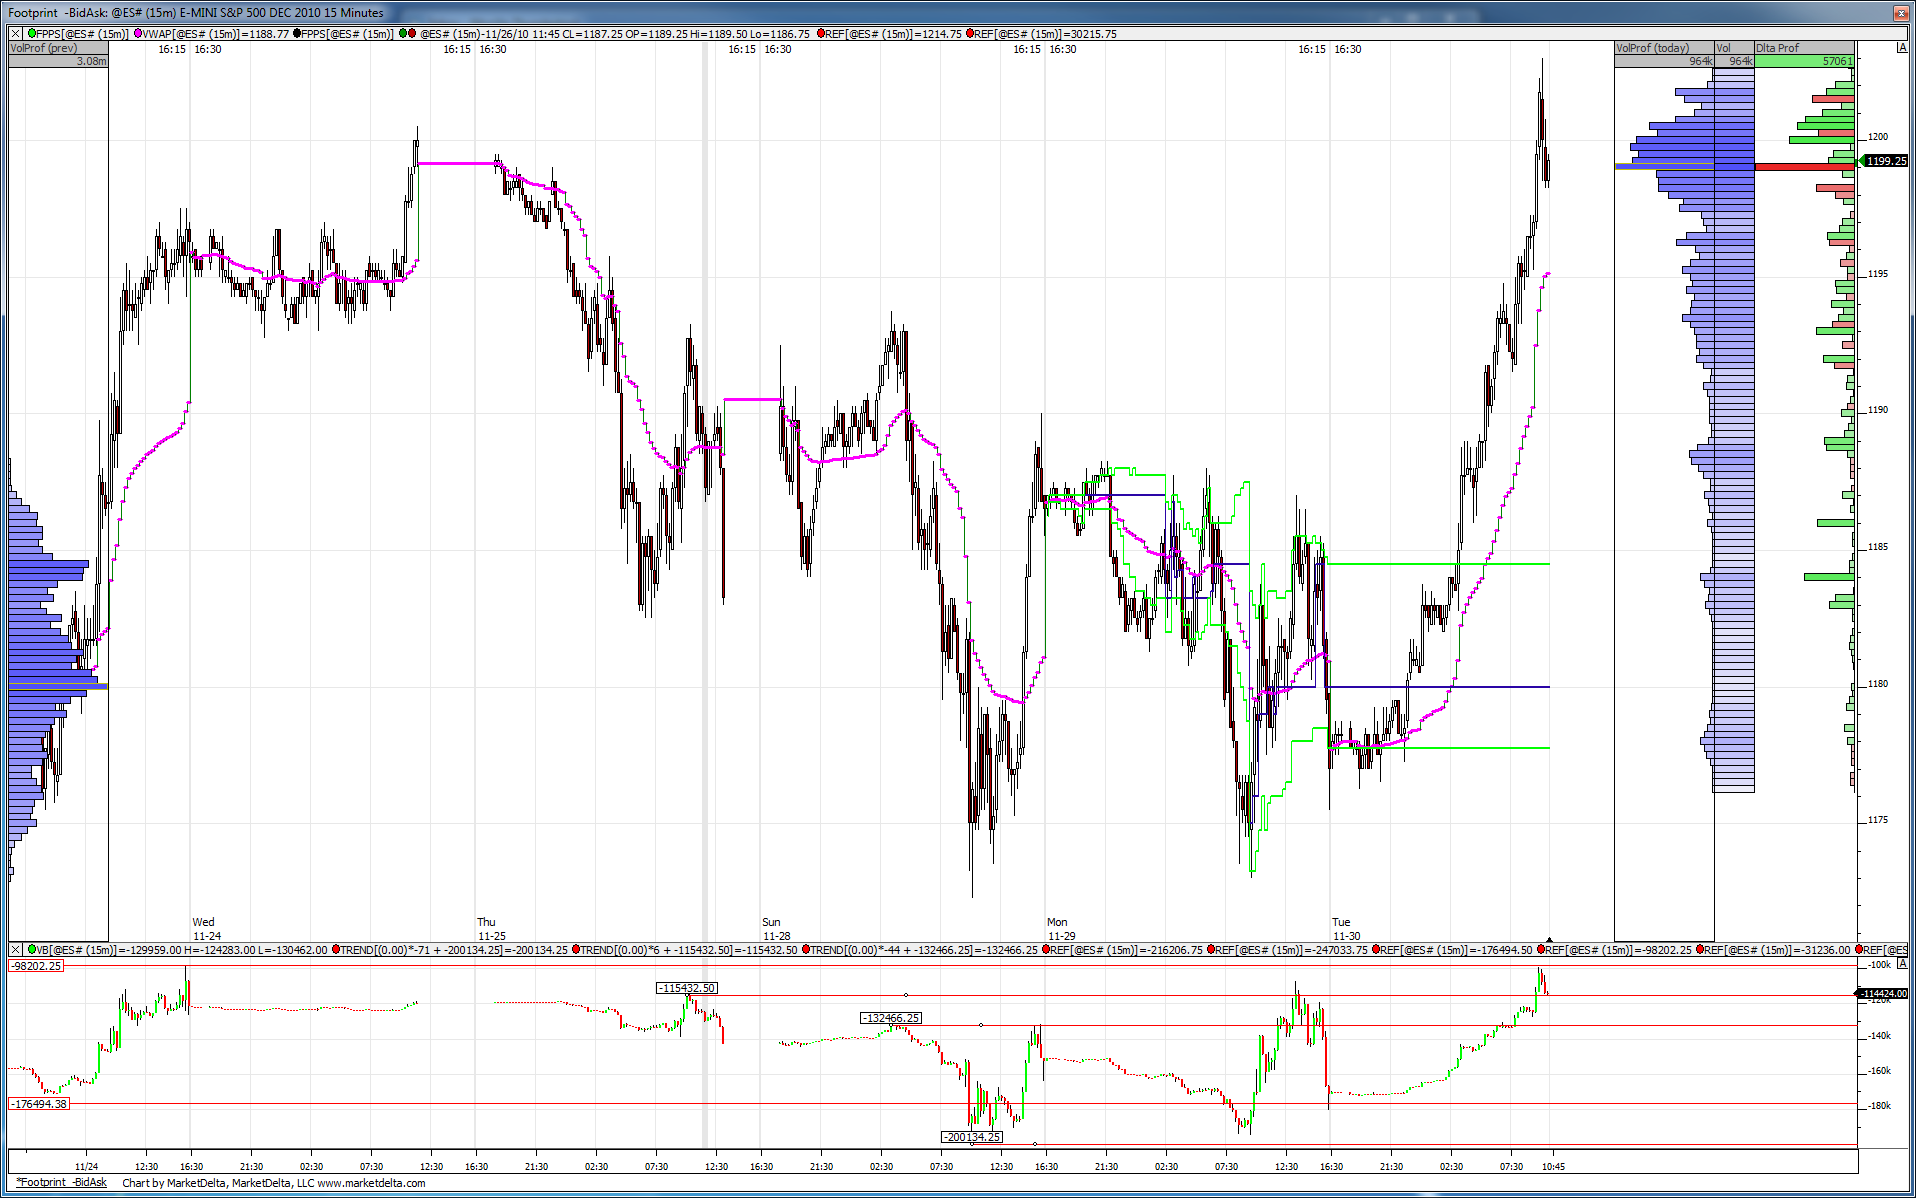
Here is the cumulative delta picture. Yesterday as prices rallied CD (cumulative delta) found resistance at the Friday peak, then as prices sold off CD stopped at that support area where buying has been entering the market over the last two days.
Now we have this large rally in the O/N but CD is still below yesterday's peak.
What this all means is within the last few days price range there has been no real net gain in either short inventory or long inventory.
Lets see if RTH brings in new volume.
Now we have this large rally in the O/N but CD is still below yesterday's peak.
What this all means is within the last few days price range there has been no real net gain in either short inventory or long inventory.
Lets see if RTH brings in new volume.
interesting Lorn...should be a fun one today..thanks for that
I'm using 95 , 88 and 1202 as keys..prefer sells....as usual
Remember 1201 is the 1.618 of Monday's range. 1207.75 would be the 2.000 number.
I'm watching for signs of the failed breakout of the bigger "C" pattern.....above the 1200...but prefer the 1202 number...air below now...that is harder air as it if from first 5 minute bar and an open outside of range
also have price action resistance at 1200-1201 with Wkly R1 at 1201.25 (and obviously 1200 as a "round" number) ... next price action resistance level I have above is 1205-1206 area
small short 01.75..very small ..reports...core short will go at 1206.....with air pocket if it forms...targeting 97.50...all signs point to trend so agressive on fades is high risk
so far it seems that nobody is interested in trade OUTSIDE the "C" pattern highs...at least based on volume...the day is young...just covered at 99.25....nothing working...will resell on test higher if it comes with low volume again
hey lorn is CD way above now that level or is it still divergent and lower...implying that we may regress back to the mean
CD picture is showing a higher resistance level reached on the spurt up from the open. Pulled back now into what might be considered support from YD high....
This just popped into my brain while I'll sit here.......have you ever put a Market profile chart on the Cummulative delta....via TPO's....just throwing that out there...
I'm selling above 1200 now......new highs will scare me out most likely unless volume drops off.....stuck in hour range ...AGAIN...boring!!
I'm selling above 1200 now......new highs will scare me out most likely unless volume drops off.....stuck in hour range ...AGAIN...boring!!
haha! That is a new saying for sure....
"When it trends we will lose!"
"When it trends we will lose!"
Originally posted by BruceM
so now we have three magnets below:
1) quads
2) triples
3) single print complete fill
and when it trends we will lose!
Emini Day Trading /
Daily Notes /
Forecast /
Economic Events /
Search /
Terms and Conditions /
Disclaimer /
Books /
Online Books /
Site Map /
Contact /
Privacy Policy /
Links /
About /
Day Trading Forum /
Investment Calculators /
Pivot Point Calculator /
Market Profile Generator /
Fibonacci Calculator /
Mailing List /
Advertise Here /
Articles /
Financial Terms /
Brokers /
Software /
Holidays /
Stock Split Calendar /
Mortgage Calculator /
Donate
Copyright © 2004-2023, MyPivots. All rights reserved.
Copyright © 2004-2023, MyPivots. All rights reserved.

