ES S/R Map for 11-22-10
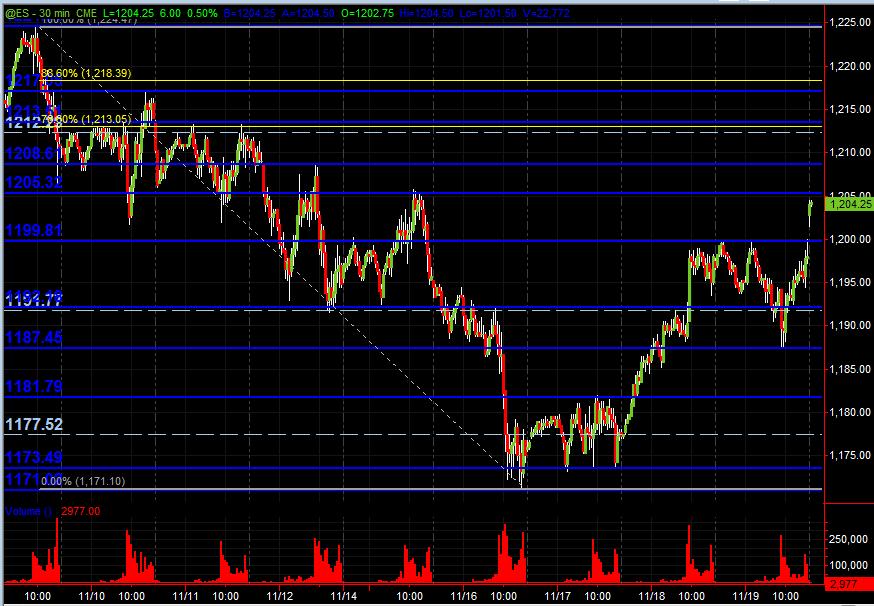
Here’s what I’m looking at with S/R levels using a 30-minute ES chart … Blue lines PASR, dashed White lines Wkly Pvts and Yellow lines are Fib retracements from recent highs. These are the levels of what I’m looking at coming into Monday’s trading. ES is currently trading up into the 1205 (minor) PSAR resistance zone for now at 6pm Central Time. Hope this is useful as a MAP for trading.
1217-1218.25 PASR resistance and Fib 886 retracement
1212.25-1213.5 is PASR resistance and Wkly Pvt plus a Fib 786 retracement (higher significance)
1208.50 PASR resistance w/Daily S2 3 ticks away
1199-1200 PASR support
1191.75-1192.25 PASR support and Wkly Pvt and Daily S1 w/in a few ticks (higher significance)
1187.50 PASR support
My 83 - 84 area was half the gap fill from Thursdays RTH open to Wednesdays close.....S2 is down there too and probably a better number
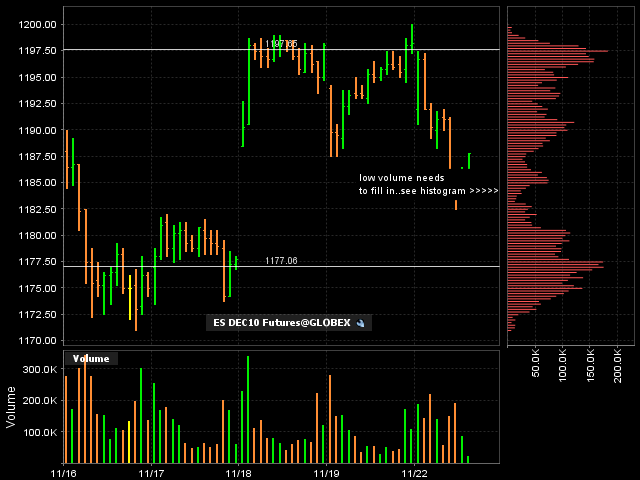
here is how my chart looks ( or one of them).....we need to fill in this low volume area between the high volume up at 98 and 76 - 77....
the SPECIFIC key low volume is now at the 82 - 88 area...so rallies that fail now above 1188( if they fail)will try to drive back down into that zone.....
the chart says it better...we may stay sandwhiched a bit.....
the SPECIFIC key low volume is now at the 82 - 88 area...so rallies that fail now above 1188( if they fail)will try to drive back down into that zone.....
the chart says it better...we may stay sandwhiched a bit.....
we've gone from having peak volume down at 85.50 to peak volume up at 91 which is right at the daily midrange...so price is once again accepted at HIGHER prices....much harder to short but if one does it should be above 91 now expecting the market to stay symetric...and come back and jerk around 91 price..
Many times we see the market just fluctuate above and below peak volume when it falls in the center of the range..trapping traders who expect it to break away...
the only challenge to my theory of price staying around this 91 is that 86.75 area.....nobody is trading that today...like a giant freaking whole in the chart...that also likes to attract price.....so let the battle begin!!
on the 94.25 short ..only because of the tiples....and going small
92 even is my best and flat..no ammo...now every MP player in the world will be watching 91.25 as that is peak volume...will they close it symetric or on an extreme.....? who really knows...I don't
Emini Day Trading /
Daily Notes /
Forecast /
Economic Events /
Search /
Terms and Conditions /
Disclaimer /
Books /
Online Books /
Site Map /
Contact /
Privacy Policy /
Links /
About /
Day Trading Forum /
Investment Calculators /
Pivot Point Calculator /
Market Profile Generator /
Fibonacci Calculator /
Mailing List /
Advertise Here /
Articles /
Financial Terms /
Brokers /
Software /
Holidays /
Stock Split Calendar /
Mortgage Calculator /
Donate
Copyright © 2004-2023, MyPivots. All rights reserved.
Copyright © 2004-2023, MyPivots. All rights reserved.

