ES Short Term Trading 9-20-10
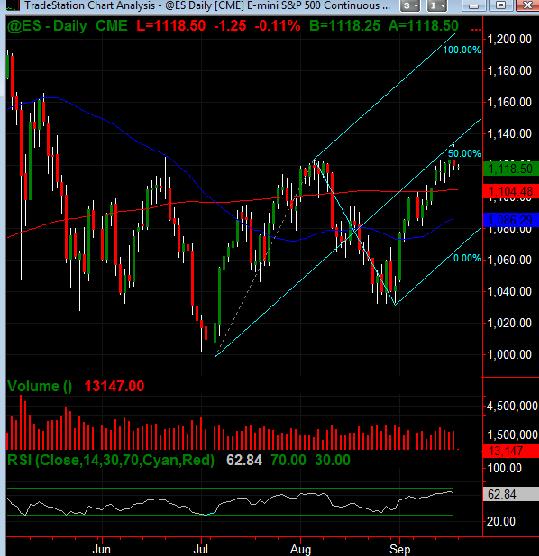
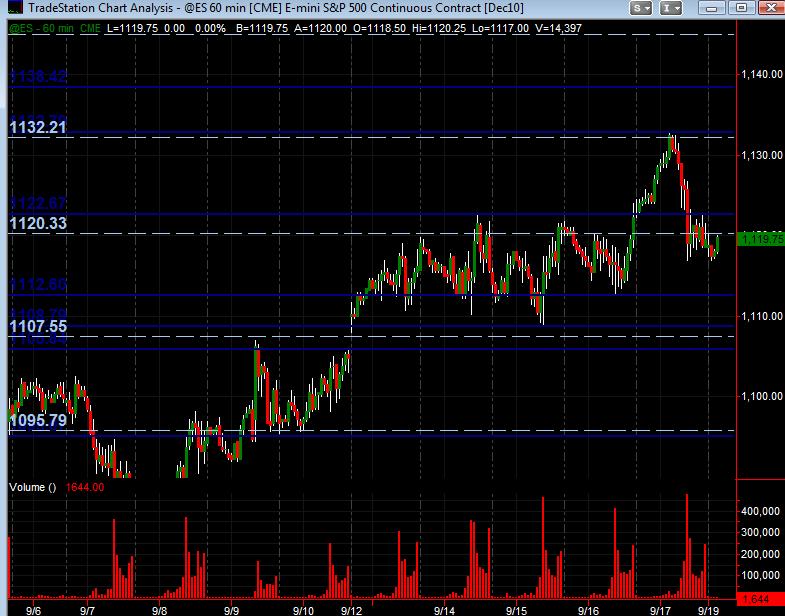
Have a daily and 60min ES. The daily has 50(blue) and 200(red) SMA's ... plus I've got an Andrews Pitchfork that I drew in over a week ago that may have some usefulness depending on your approach to the market. Both charts are All Hours Trading. The 60min chart of Price Action S/R levels are in dark blue with the Wkly Pvts "in the background" as dashed cyan lines.
This is just a MAP of potential S/R levels for my own trading. What I'm finding more and more difficult is how heavily to way the RTH chart readings of S/R with the All Hours. Anyway, it's a melding of the two. Hope this is helpful as a departure point/map for Monday's trading.
Using TS for now as TOS (which I've posted charts of the last few months) is Monkeying with my mind ... can't get comfortable with it yet I guess.
Fwiw ... the Daily Pvts for Monday that coincide with a price action S/R level and/or Wkly Pvts are:
1139.00
1123.25
1113.50
1107.50
Just pointing out some confluence. Hopefully will have time to post what I see as potentially the most significant S/R levels a little later.
The Funky Munkey
1139.00
1123.25
1113.50
1107.50
Just pointing out some confluence. Hopefully will have time to post what I see as potentially the most significant S/R levels a little later.
The Funky Munkey
I'm with you Monkey on figuring out how much to weigh O/N action verses RTH action, separately or together in the all hours view you are showing.
What is this?
Here's the chart I posted Friday afternoon with the high marked at 1130.25
Nobody questioned the chart in the forum at the time even though I had discussed the subject of my target levels and the December contract not hitting the 1132 or 1137 target levels(5 pt adjustment)
.
Here's the chart I posted Friday afternoon with the high marked at 1130.25
Nobody questioned the chart in the forum at the time even though I had discussed the subject of my target levels and the December contract not hitting the 1132 or 1137 target levels(5 pt adjustment)
.
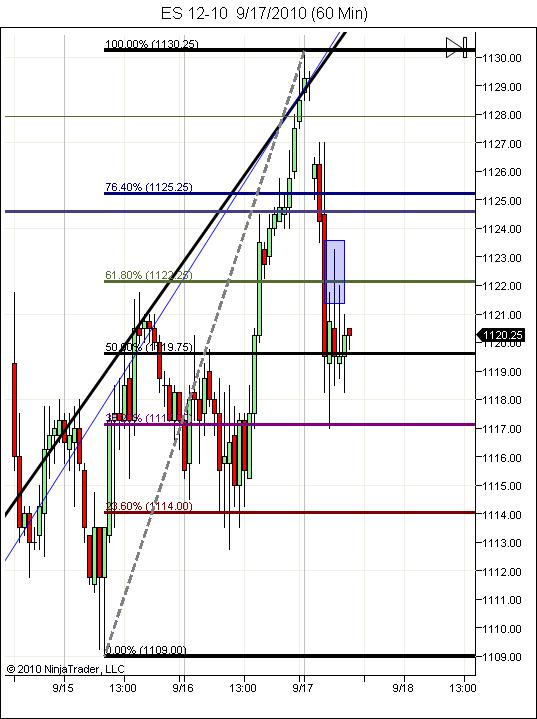
Tonight, I opened up my NT charts and this is the same chart without any adjustments by me. Note the fib levels have not moved.
Can anyone explain this variance for Fridays high being different on this chart vs. Fridays chart? Is this some snafu of NT, my provider? Did anyone have 1132.75 as the high Friday on Friday?
Thanks in advance. file]88b20986-27dd-44a2-a41b-ca6375a17afe[/file]
Can anyone explain this variance for Fridays high being different on this chart vs. Fridays chart? Is this some snafu of NT, my provider? Did anyone have 1132.75 as the high Friday on Friday?
Thanks in advance. file]88b20986-27dd-44a2-a41b-ca6375a17afe[/file]
Hi David. I must admit that didn't register in my tiny brain Friday.
Both my tradestation and my NT platforms show 1132.75 as the high on Friday and I do recall that being the high Friday.
Maybe it was your data provider and its been corrected now?
Strange though.
Both my tradestation and my NT platforms show 1132.75 as the high on Friday and I do recall that being the high Friday.
Maybe it was your data provider and its been corrected now?
Strange though.
Thanks Lorn.
I also checked the daily notes and it has 1132.75 as the high Friday. hmmm
I also checked the daily notes and it has 1132.75 as the high Friday. hmmm
1132.75 or 1130.25?
Originally posted by MonkeyMeat
Hey David,
Got that same High for the Dec contract thru Tradestation data.
Originally posted by DavidS
1132.75 or 1130.25?Originally posted by MonkeyMeat
Hey David,
Got that same High for the Dec contract thru Tradestation data.
32.75
Appreciate the feedback as I rely on charts. Maybe I'll check with NT but I find that's usually frustrating with any provider.
Thanks again!
Thanks again!
yes and very selective...tomorrow I hopefully get free from these "wrappings".....I'm stalling as I am not looking forward to changing my kids diaper once again.....LOL!! My wife has had a ton of work around here....she needs a break!!
Emini Day Trading /
Daily Notes /
Forecast /
Economic Events /
Search /
Terms and Conditions /
Disclaimer /
Books /
Online Books /
Site Map /
Contact /
Privacy Policy /
Links /
About /
Day Trading Forum /
Investment Calculators /
Pivot Point Calculator /
Market Profile Generator /
Fibonacci Calculator /
Mailing List /
Advertise Here /
Articles /
Financial Terms /
Brokers /
Software /
Holidays /
Stock Split Calendar /
Mortgage Calculator /
Donate
Copyright © 2004-2023, MyPivots. All rights reserved.
Copyright © 2004-2023, MyPivots. All rights reserved.


