ES Short Term Trading 8-5-2010
Numbers that can act as support if we go below 1115.50:
1113.25 - LOD of 8/3 (Tue)
1110.25 - LOD of 8/2 (Mon) , This week's Low so far
Unfilled Gaps:
8/2 - 1100.25 to 1110.25
7/22 - 1064 to 1078.25
1113.25 - LOD of 8/3 (Tue)
1110.25 - LOD of 8/2 (Mon) , This week's Low so far
Unfilled Gaps:
8/2 - 1100.25 to 1110.25
7/22 - 1064 to 1078.25
I'd add 1112.50 which is projection down from todays 1127.75 O/N peak.
Originally posted by hari
Numbers that can act as support if we go below 1115.50:
1113.25 - LOD of 8/3 (Tue)
1110.25 - LOD of 8/2 (Mon) , This week's Low so far
Unfilled Gaps:
8/2 - 1100.25 to 1110.25
7/22 - 1064 to 1078.25
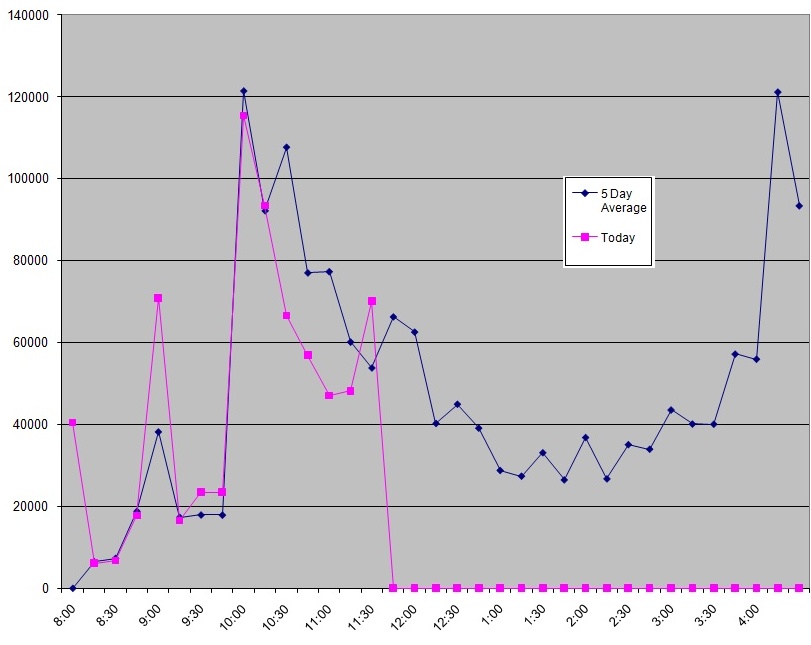
Volume has suddenly jumped on this mini rebound. Bears need to act here or higher numbers coming.
ES, YM showing relative strength compared to NQ, TF.
My experience shows this is usually resolved one way or another by the end of the day.
I don't have hard measurements to show on this but we go in cycles where NQ leads and the rest follow and then suddenly ES leads and the rest follow.
Problem is I never know which one is leading!
My experience shows this is usually resolved one way or another by the end of the day.
I don't have hard measurements to show on this but we go in cycles where NQ leads and the rest follow and then suddenly ES leads and the rest follow.
Problem is I never know which one is leading!
I have read in several places that TF usually leads ES
and NQ usually leads YM. Not much is talked about NQ or YM vs ES, TF
and NQ usually leads YM. Not much is talked about NQ or YM vs ES, TF
Originally posted by Lorn
ES, YM showing relative strength compared to NQ, TF.
My experience shows this is usually resolved one way or another by the end of the day.
I don't have hard measurements to show on this but we go in cycles where NQ leads and the rest follow and then suddenly ES leads and the rest follow.
Problem is I never know which one is leading!
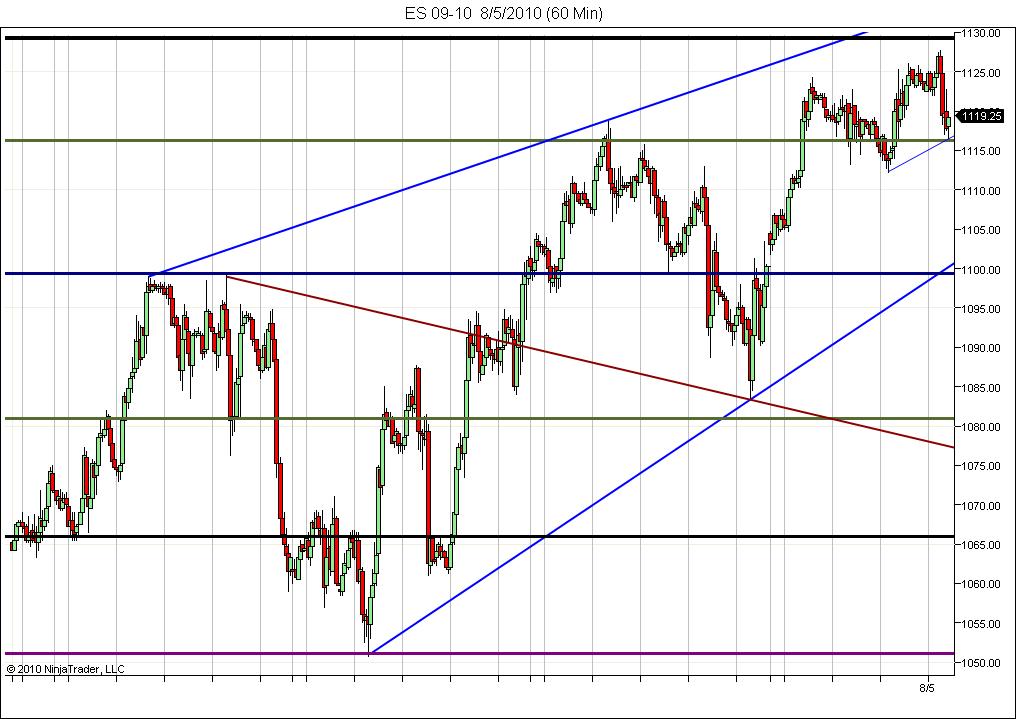
1129 still not touched and close doesn't count with a previous high.
1116.25 has not broken(green line) from yesterdays beginning of an impulse wave up so we can still be in a 2nd wave until it does.
My count can be wrong, doesn't matter, it's a framework. The 1112.25 low can still be the 1st wave and 2nd wave can go back to there.Just info for decision process.
Also note the chart altrnative for a decline to the red line. Nothing says the upper line of the diagonal has to be touched.
I giving the edge to the downside based on the patterns even though 1116.25 not broken. Also the tempo shifted yesterday on the ascent from 119.75. If so, I don't think the intraday high should break today, but we can end the day there if it holds up. If we break up above 1123, I'll reevaluate. I'm really not seeing anything positve yet ie; stocks,indicators,pattern. Let's see what lunch brings?
Still watching S&P 1120.44 and noting futures equivalent S (at 1107.5).
TF is way too volatile for me to use as a leading indicator but I normally watch NQ for an early sign of directional change as well as weakness/strength compared to ES.
Cheers!
Cheers!
Originally posted by hari
I have read in several places that TF usually leads ES
and NQ usually leads YM. Not much is talked about NQ or YM vs ES, TF
Originally posted by Lorn
ES, YM showing relative strength compared to NQ, TF.
My experience shows this is usually resolved one way or another by the end of the day.
I don't have hard measurements to show on this but we go in cycles where NQ leads and the rest follow and then suddenly ES leads and the rest follow.
Problem is I never know which one is leading!
I'm liking the thought process Dave. You bring up a great point in watching the cash index. I think it represents a greater array of players then just the futures and hence has extreme value in telling us what might be going on.
Cheers!
Cheers!
Originally posted by DavidS
1129 still not touched and close doesn't count with a previous high.
1116.25 has not broken(green line) from yesterdays beginning of an impulse wave up so we can still be in a 2nd wave until it does.
My count can be wrong, doesn't matter, it's a framework. The 1112.25 low can still be the 1st wave and 2nd wave can go back to there.Just info for decision process.
Also note the chart altrnative for a decline to the red line. Nothing says the upper line of the diagonal has to be touched.
I giving the edge to the downside based on the patterns even though 1116.25 not broken. Also the tempo shifted yesterday on the ascent from 119.75. If so, I don't think the intraday high should break today, but we can end the day there if it holds up. If we break up above 1123, I'll reevaluate. I'm really not seeing anything positve yet ie; stocks,indicators,pattern. Let's see what lunch brings?
Still watching S&P 1120.44 and noting futures equivalent S (at 1107.5).
Thanks Lorn,
I pointed out the N's don't represent the financials well in relation to the S's(no too big to fail type banks). There's the difference between the two for me. Banks provide the fuel. I watch em for a tell. Can always have one or the other leading. What it means is the difference.
I pointed out the N's don't represent the financials well in relation to the S's(no too big to fail type banks). There's the difference between the two for me. Banks provide the fuel. I watch em for a tell. Can always have one or the other leading. What it means is the difference.
Ah great point!
Thanks.
Thanks.
Originally posted by DavidS
Thanks Lorn,
I pointed out the N's don't represent the financials well in relation to the S's(no too big to fail type banks). There's the difference between the two for me. Banks provide the fuel. I watch em for a tell. Can always have one or the other leading. What it means is the difference.
No problem Lorn, msg me if need any help
Emini Day Trading /
Daily Notes /
Forecast /
Economic Events /
Search /
Terms and Conditions /
Disclaimer /
Books /
Online Books /
Site Map /
Contact /
Privacy Policy /
Links /
About /
Day Trading Forum /
Investment Calculators /
Pivot Point Calculator /
Market Profile Generator /
Fibonacci Calculator /
Mailing List /
Advertise Here /
Articles /
Financial Terms /
Brokers /
Software /
Holidays /
Stock Split Calendar /
Mortgage Calculator /
Donate
Copyright © 2004-2023, MyPivots. All rights reserved.
Copyright © 2004-2023, MyPivots. All rights reserved.

