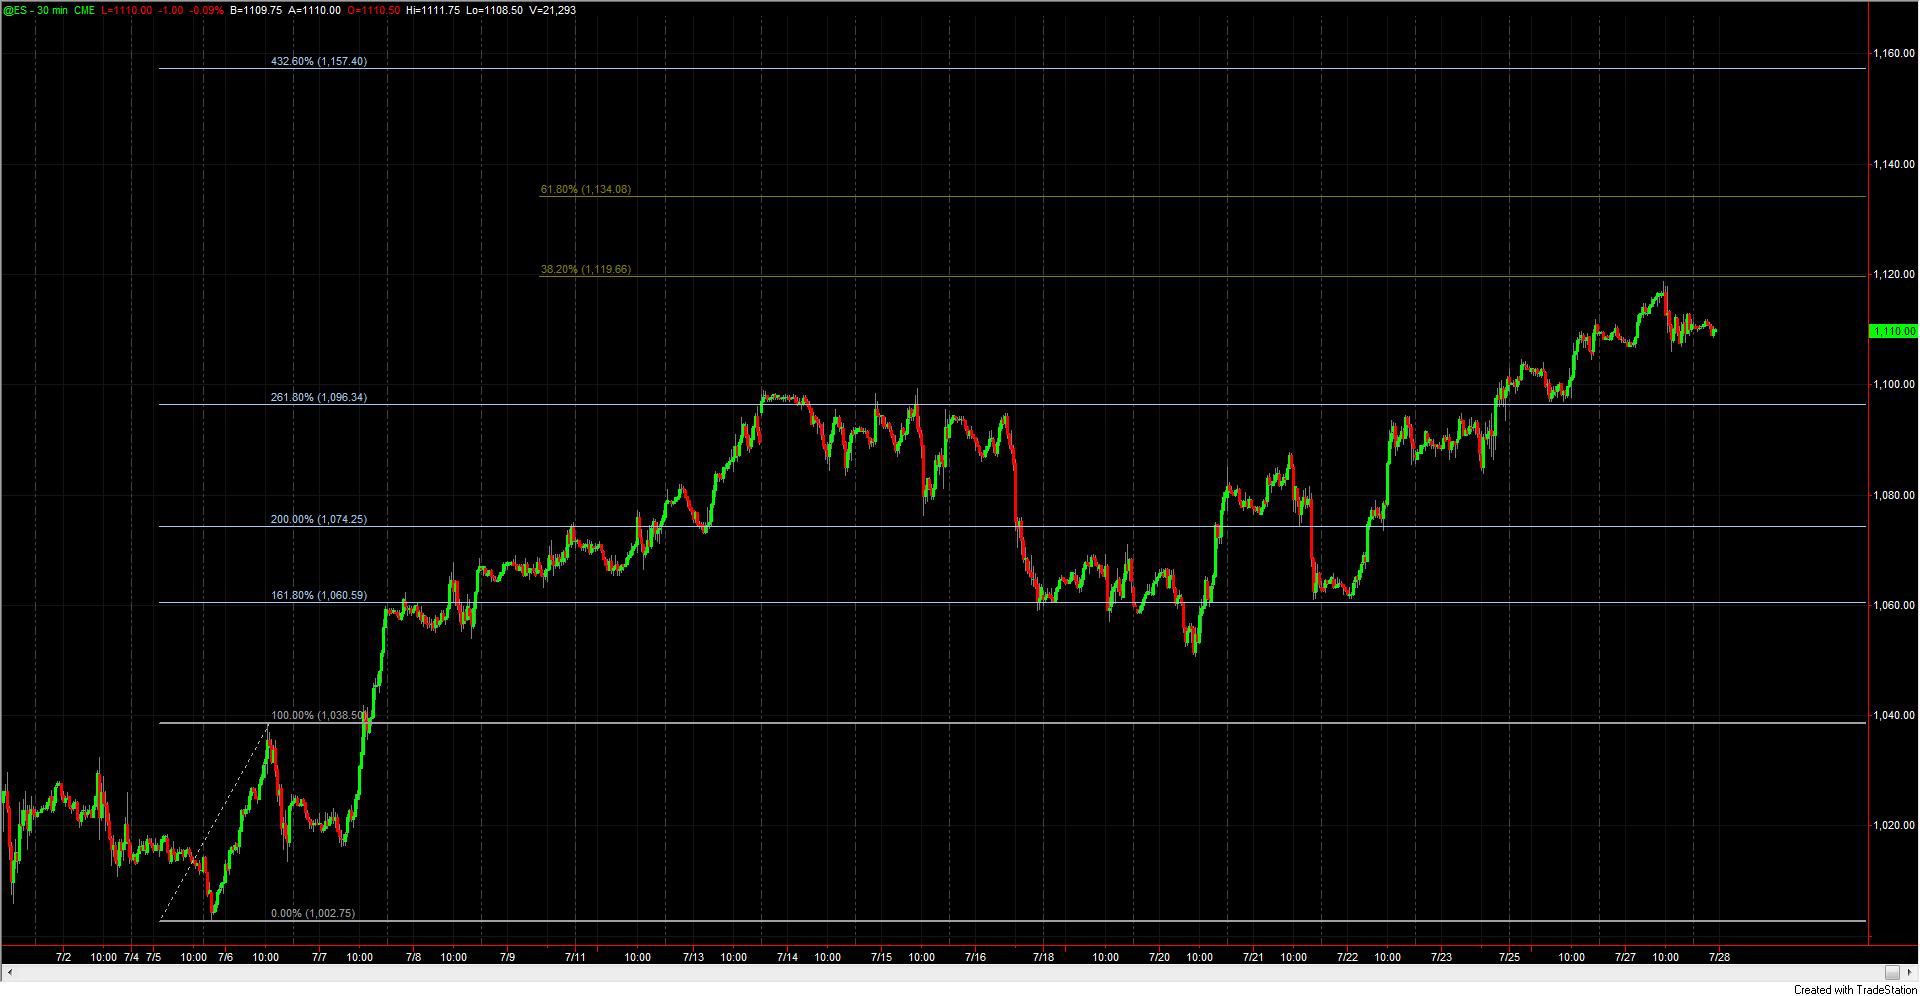
30 Min Fib Projections
Thought I'd start a thread for this subject since people have an interest in it.
Here is a 30 min continuous chart of the ES. I have used the initial move up from the low of the 5th to generate the projection.
I don't think its 100% certain prices will visit a 4.326 projection after blasting through the 2.618 projection but it is the next major projection in the series.
Dividing the two shows prices recognizing but not quite reaching the .382 subdivision of 2.618 and 4.326
Emini Day Trading /
Daily Notes /
Forecast /
Economic Events /
Search /
Terms and Conditions /
Disclaimer /
Books /
Online Books /
Site Map /
Contact /
Privacy Policy /
Links /
About /
Day Trading Forum /
Investment Calculators /
Pivot Point Calculator /
Market Profile Generator /
Fibonacci Calculator /
Mailing List /
Advertise Here /
Articles /
Financial Terms /
Brokers /
Software /
Holidays /
Stock Split Calendar /
Mortgage Calculator /
Donate
Copyright © 2004-2023, MyPivots. All rights reserved.
Copyright © 2004-2023, MyPivots. All rights reserved.
