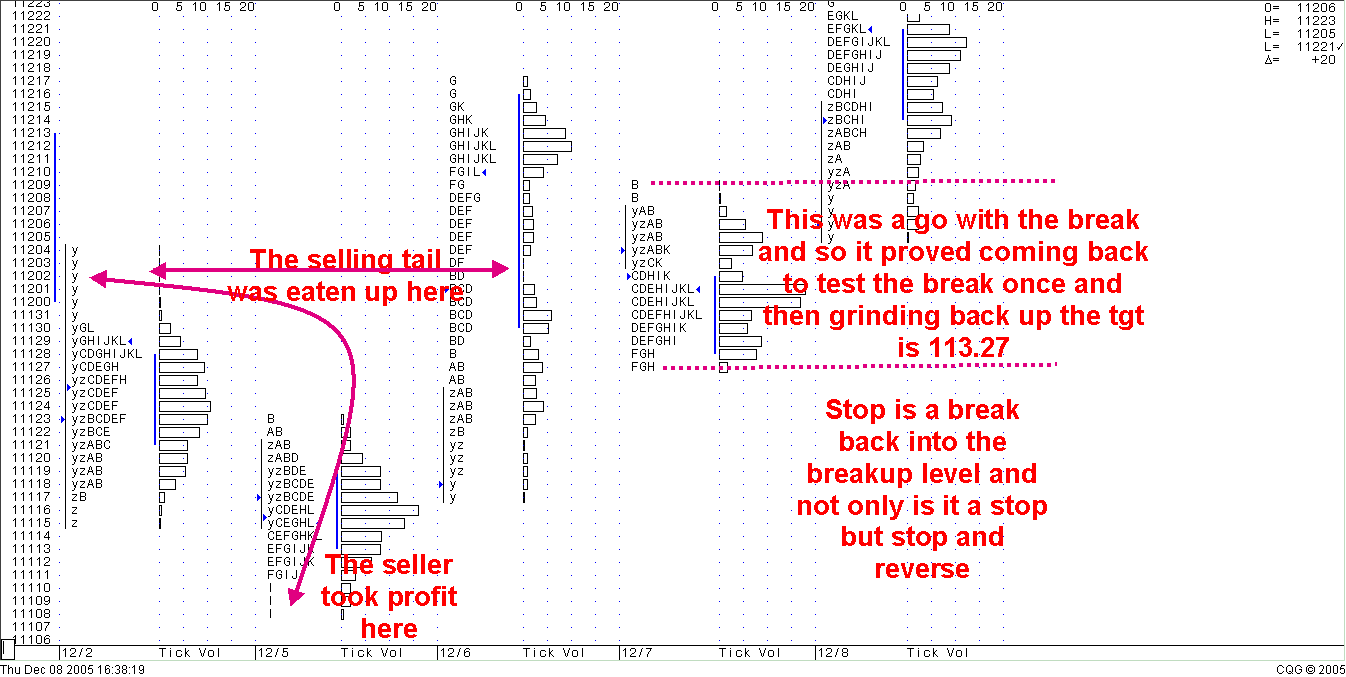
MP tgts achieved in Spoos but not in Bonds
[1272.75] H
[1272.50] H
[1272.25] HI
[1272.00] HI
[1271.75] GHI
[1271.50] GHI
[1271.25] GHI
[1271.00] GHI
[1270.75] GHI
[1270.50] GI
[1270.25] GIJ
[1270.00] FGIJ
[1269.75] FGJ
[1269.50] FGJ
[1269.25] FJ
[1269.00] FJ
[1268.75] FJK
[1268.50] FJK [VAH]
[1268.25] FJK
[1268.00] FJK
[1267.75] FJK
[1267.50] DFJK
[1267.25] DFK
[1267.00] DFK
[1266.75] DFKL
[1266.50] DFKL
[1266.25] DFKL
[1266.00] DFKL
[1265.75] DFKL
[1265.50] DFKLMQR
[1265.25] DEFKLMQR
[1265.00] DEFKLMQR
[1264.75] DEFKLMQR
[1264.50] DEFKLMPQR [POC]
[1264.25] DEFKLMPQR
[1264.00] DEFKLMPQR
[1263.75] DEFMPQ
[1263.50] DEFMPQ
[1263.25] DEMPQ
[1263.00] MNPQ
[1262.75] MNPQ
[1262.50] MNPQ
[1262.25] MNPQ
[1262.00] MNP
[1261.75] MNP
[1261.50] MNP [VAL]
[1261.25] MN
[1261.00] MN
[1260.75] N
[1260.50] N
[1260.25] N
[1260.00] N
[1259.75] N
[1259.50] N
[1259.25] N
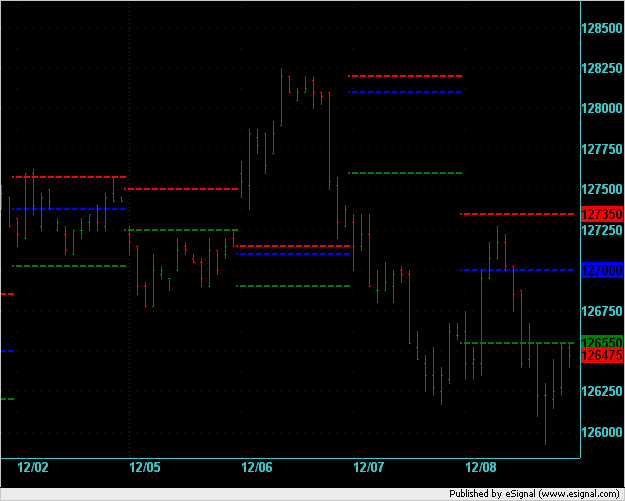
This is the Market Profile graphic in tick increments. I agree with your comments about neutral day. Here is a bar chart showing the 30min bars for the ES H6 contract over this week. The 3 horizontal lines show the VAH, POC, and VAL. On Monday the POC and VAL were the same so it looks like 1 line is missing there.
one line missing from your chart or mine or one line requiring to complete something. In reality I don t think it matters either way becasue as you will see with Fridays postings the market is showing possible signs of needing to search out lower value especially if the early Monday am open rejects the buyer. This past week has been entirely about spreads and roll-over is very similar to option expiry in that it sucks out the premium and beats everyone up until they no longer wish to play anymore. That is precisecely when you should take the next trade.
Emini Day Trading /
Daily Notes /
Forecast /
Economic Events /
Search /
Terms and Conditions /
Disclaimer /
Books /
Online Books /
Site Map /
Contact /
Privacy Policy /
Links /
About /
Day Trading Forum /
Investment Calculators /
Pivot Point Calculator /
Market Profile Generator /
Fibonacci Calculator /
Mailing List /
Advertise Here /
Articles /
Financial Terms /
Brokers /
Software /
Holidays /
Stock Split Calendar /
Mortgage Calculator /
Donate
Copyright © 2004-2023, MyPivots. All rights reserved.
Copyright © 2004-2023, MyPivots. All rights reserved.


