Es short term trading 7-26-10
The numbers seem to be getting tighter and I don't like that as it gets more confusing as to what is actually a good number. The Value area was higher and wider but Volume was only slightly higer.
Upside
1006- 1009..big volume up there
1001 - Fridays high and low composite volume
95 - 97 - Breakout and VA high ************** I think this is the most important because on friday we broke out at 95, went up to 1001, then came back down to 95 and the market held and closed at the highs....not much TIME spent here on that retest so somebody seemed to be in a rush to buy there.....we certainly don't want to gap LOWER on Monday below that
91.50 high volume
84 - 85 *******single prints began there and Fridays lows and it is now the weekly Pivot
80- high volume
73- 75 key from composite
watching a new number at 69.50 ...this is a low volume spot that the market blew through on the down and then the upside...so no time was spent there
I had a question about the weekly IB. I had read somewhere that weekly IB is established at EOD of Tuesday. Is that true?
Is it possible to post the VAH - POC - VAL for the globex moves?
Is it possible to post the VAH - POC - VAL for the globex moves?
Originally posted by mgattani
I had a question about the weekly IB. I had read somewhere that weekly IB is established at EOD of Tuesday. Is that true?
If you are using each day's trading session as a TPO bracket, then in theory you could use the first two day's of the week as the brackets to represent the Initial Balance for the "weekly" profile. The question then becomes which 2 day's to use for the IB, because choosing Monday-Tuesday is purely arbitrary. For example, Steidlmayer in his book Trading with Market Pofile suggests using 4pm Tuesday to 4pm Thursday as the Initial Balance for a longer term profile of the WTI Crude market, based upon the weekly release of the API statistics each week. This is based on his concept of using a standardized reference point for the beginning and ending of the profile. Starting with a standardized weekly IB, you could then make statistically meaningful projections from that for the anticipated initiative range expansion.
Is it possible to post the VAH - POC - VAL for the globex moves?
Ensign Software's "price histogram" study allows you to the split out the globex session from the RTH session into two separate profiles for each complete day of trading.
For Monday 7/26/2010
Daily Range Based S/R
R1 = 1105.875
S1 = 1079.625
R2 = 1110.25
S2 = 1075.25
Weekly Range Based S/R
R1 = 1114.25
S1 = 1038.00
R2 = 1125.875
S2 = 1025.375
Cheers!
Daily Range Based S/R
R1 = 1105.875
S1 = 1079.625
R2 = 1110.25
S2 = 1075.25
Weekly Range Based S/R
R1 = 1114.25
S1 = 1038.00
R2 = 1125.875
S2 = 1025.375
Cheers!
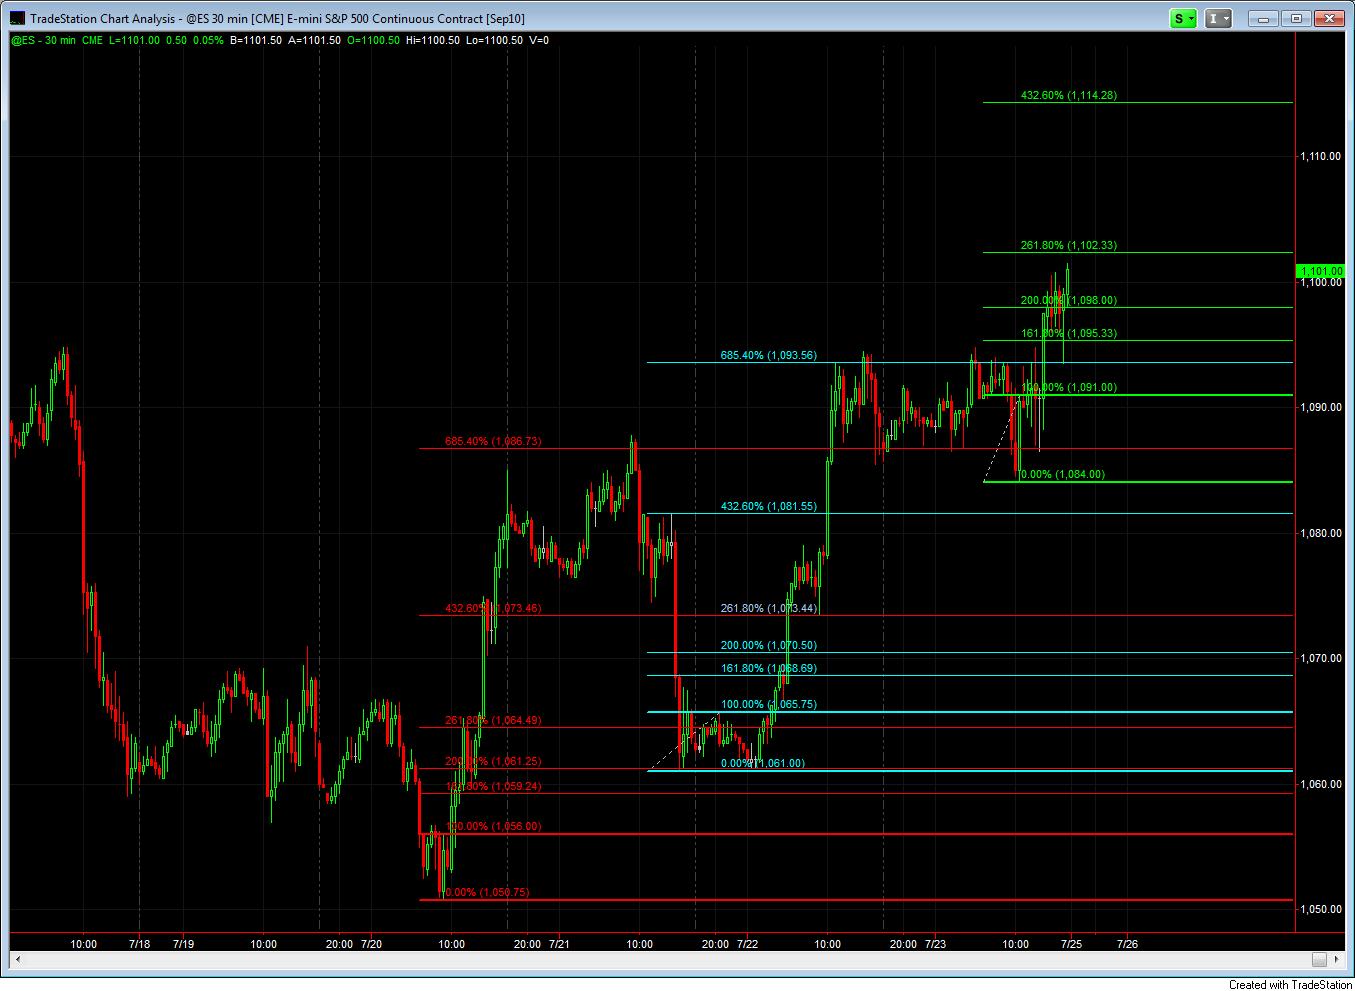
Here is a 30 min Kool fib projection. Green lines are drawn from the 30 min reversal bar on Friday. I left the other two studies on the chart so you can see how prices have reacted on some of the prices. Interesting stuff!
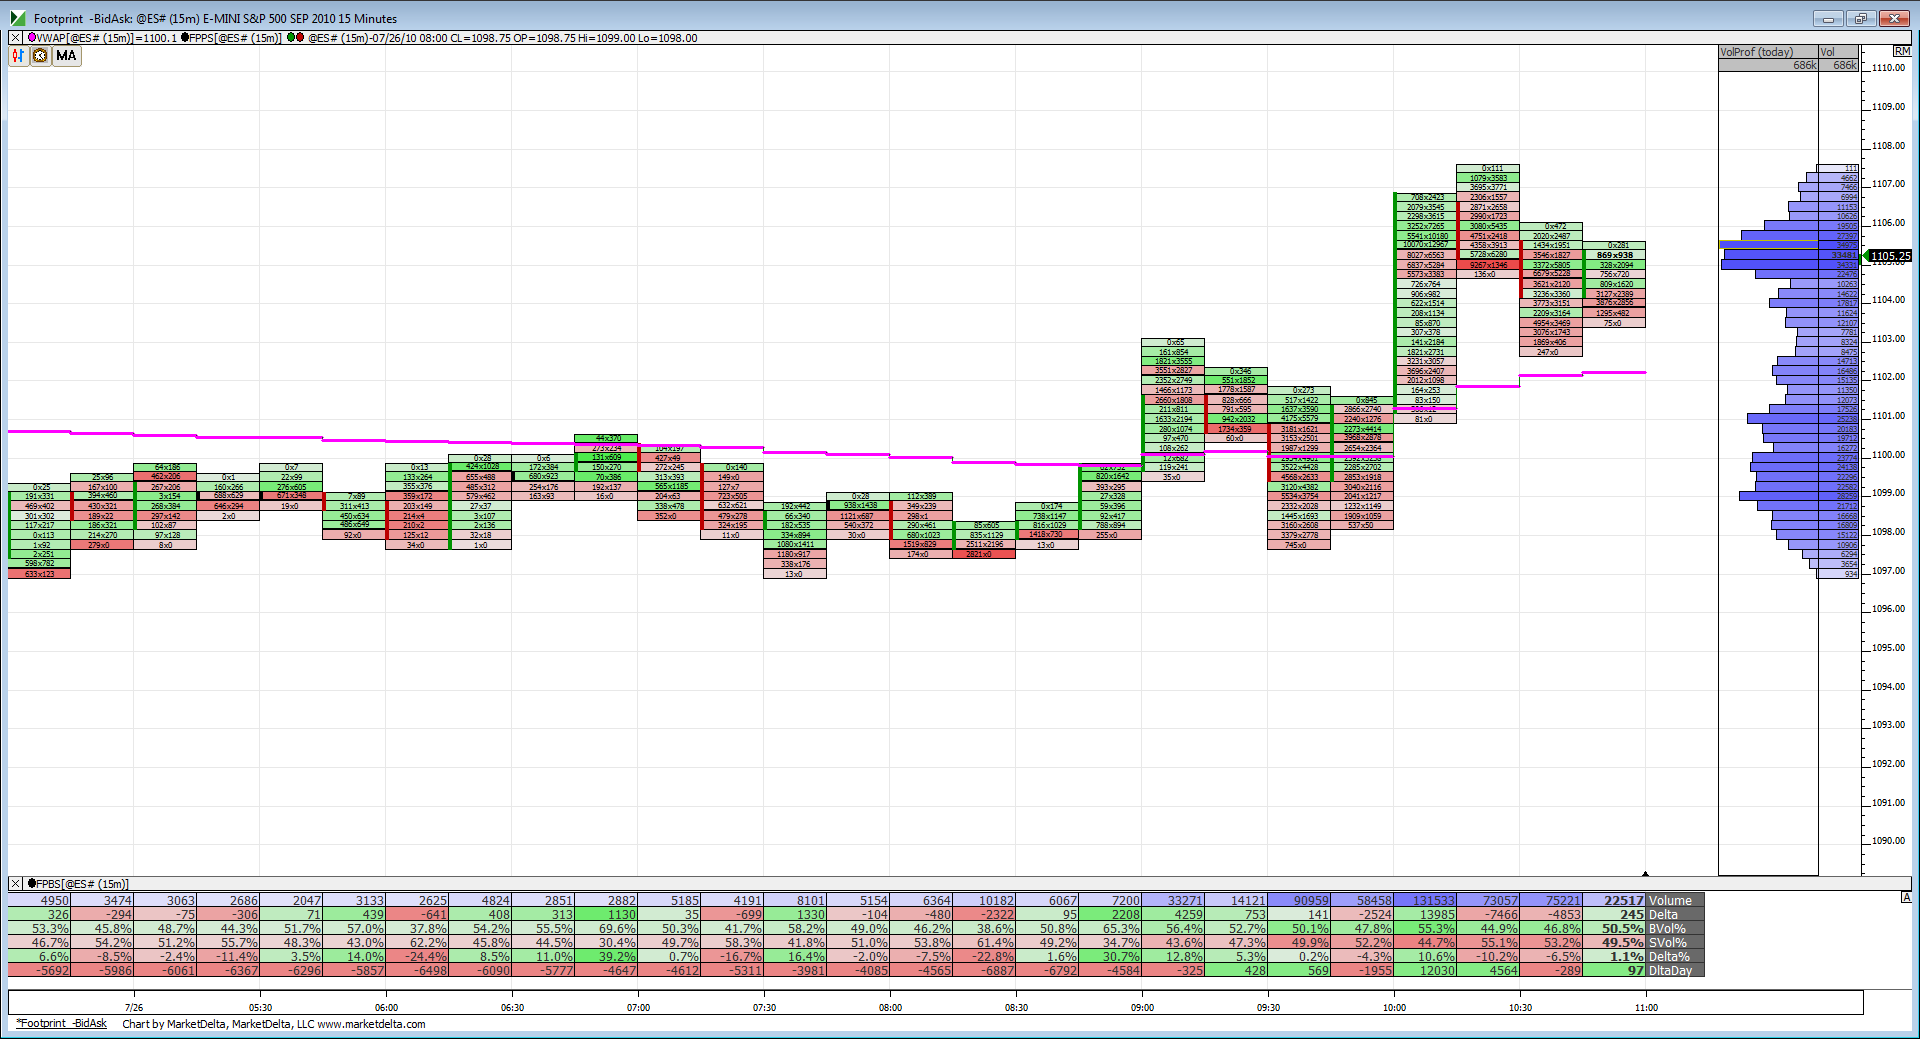
15 min footprint chart showing prices using VWAP as support for the moment and volume building up in the 1105-1106 zone.
It will be interesting to see if prices can reach that 1114.25 projection on the 30 min chart.
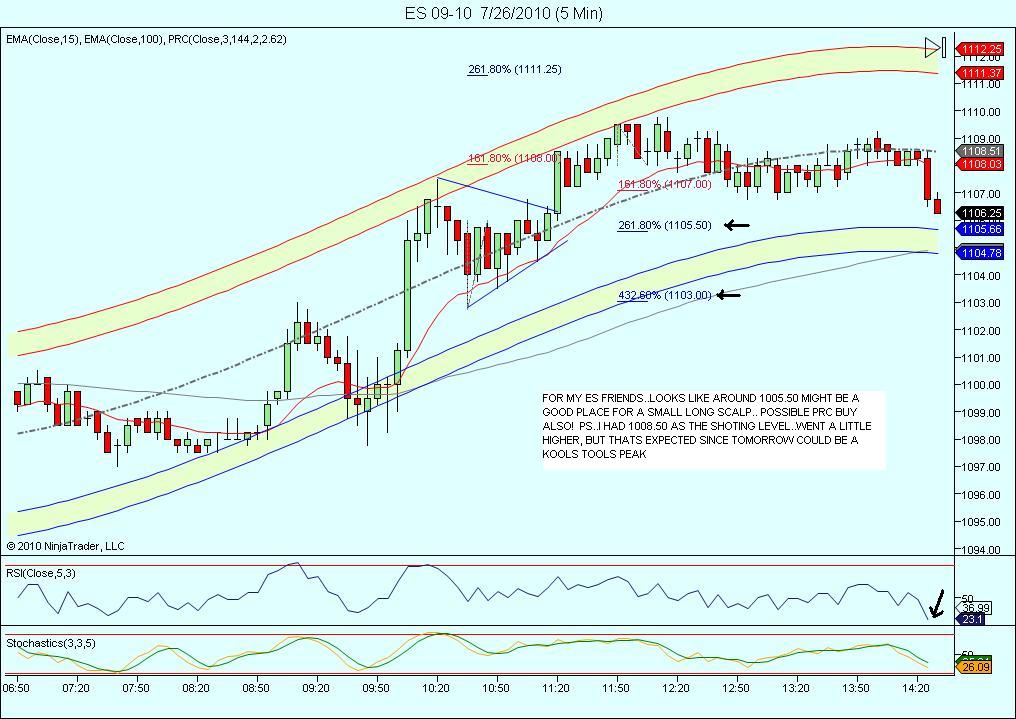
looking at 1111.35 as today's top.
Other peoples thoughts?
Other peoples thoughts?
Any particular reason for that number?
Originally posted by blue
looking at 1111.35 as today's top.
Other peoples thoughts?
Here is something i like to do on longer term fib projections. Divide the levels themselves to find the .382 and .618 lvls. You can see on this chart prices have come off the .618 lvl and bouncing on the .382 lvl. Could be a stair step up to the 4.382 lvl.
A nice call for sure Blue..I had the R2 level about a point higher but Lorn here and myself would like to know why you had that number..not sure if you forgot to give an answer ....you don't seem like the "post and boast" type.....so when you have a chance can you elaborate..
Originally posted by blue
Originally posted by Lorn
Any particular reason for that number?
Originally posted by blue
looking at 1111.35 as today's top.
Well 1111.25 was my best calc
Other peoples thoughts?
Emini Day Trading /
Daily Notes /
Forecast /
Economic Events /
Search /
Terms and Conditions /
Disclaimer /
Books /
Online Books /
Site Map /
Contact /
Privacy Policy /
Links /
About /
Day Trading Forum /
Investment Calculators /
Pivot Point Calculator /
Market Profile Generator /
Fibonacci Calculator /
Mailing List /
Advertise Here /
Articles /
Financial Terms /
Brokers /
Software /
Holidays /
Stock Split Calendar /
Mortgage Calculator /
Donate
Copyright © 2004-2023, MyPivots. All rights reserved.
Copyright © 2004-2023, MyPivots. All rights reserved.


