ES short term trading 7-20-10
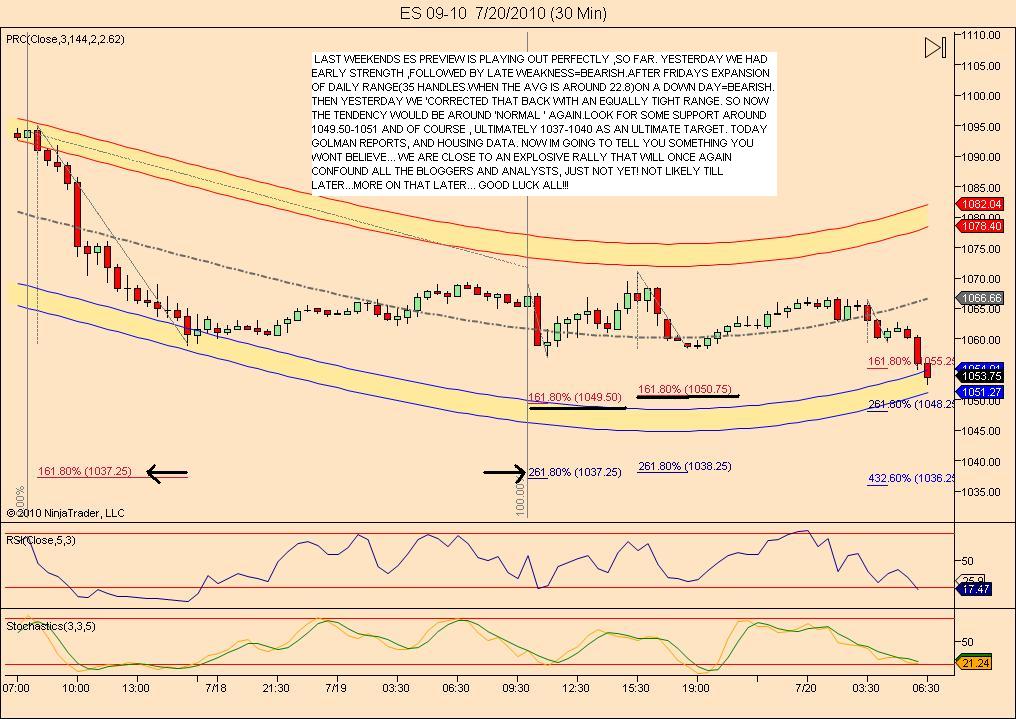
When i projected much lower prices,last weekend, few believed it. Everyone was looking for another 1100 test and higher. You probably wont believe what i feel comes next either! lol.. But enough macro crap, heres a snapshot of the near term ,going into the morning....
Can you post a chart Paul? Interesting observation.
I'll try to post a chart but believe me, my profile is not as good looking as other charts posted here.
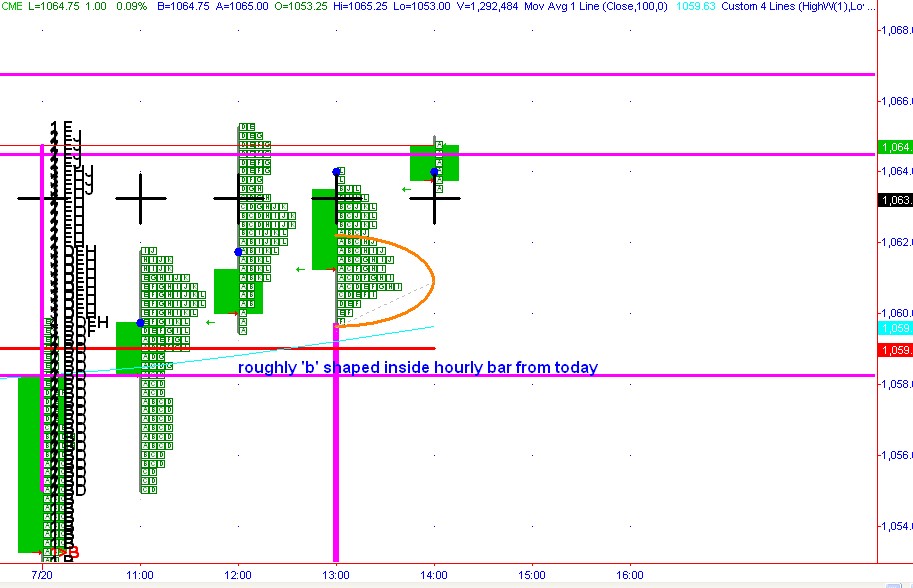
right now, bar has completed, 'b' formation more or less remained in place, previous bar remained an inside bar, same as yesterday.
if price moves above H of 'b' bar, (h was 1064.00), want to see what happens to price.
right now, bar has completed, 'b' formation more or less remained in place, previous bar remained an inside bar, same as yesterday.
if price moves above H of 'b' bar, (h was 1064.00), want to see what happens to price.
1066-1067 could still be resistance. As you say Paul lets see what prices do above 1064. But I see 1065 as being the price to get above before higher numbers can be challenged.
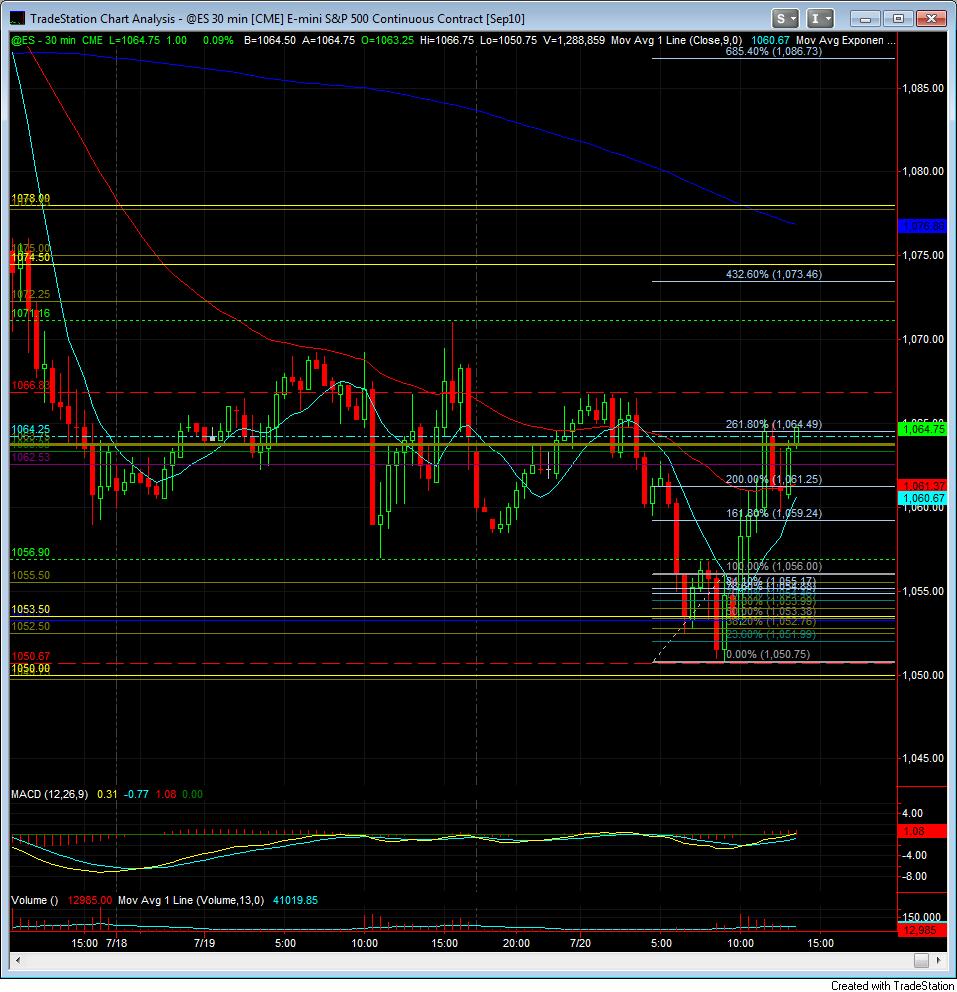
Using Kools projection technique here is my 30 min chart with a projection off the low of today.
here is what I described, sorry about all the distance to the price scale at the right
it is not as "thin" at the top (yesterday was thinner at the top
this is today
it is not as "thin" at the top (yesterday was thinner at the top
this is today
The 1:30pm close should be telling.
here is the inside, 'b' bar from yesterday, notice how much thinner the upper leb of the volume p[rofile is.
One otyher thing that';s kind of interesting, very near the same price for the H. H of yesterday's inside 'b' bar was 1065.00
you mentioned 65, yes, I can see on the chart 65.25 today was a stopper... let's see what unfolds.
One otyher thing that';s kind of interesting, very near the same price for the H. H of yesterday's inside 'b' bar was 1065.00
you mentioned 65, yes, I can see on the chart 65.25 today was a stopper... let's see what unfolds.
Do you think it matters that today's inside bar on your chart closed up while yesterday's closed down?
AAPL almost 10 from lod, have they conditioned shorts enough to act prior to earnings today?
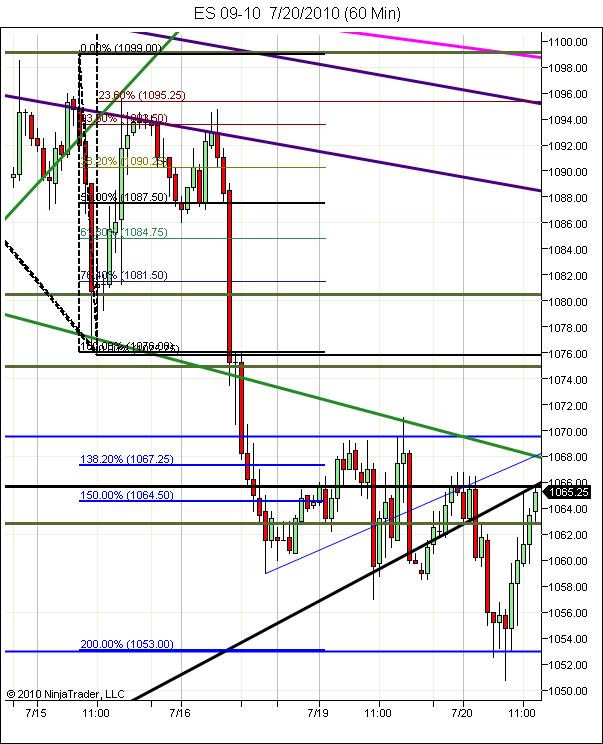
1 hr chart 50 sma at 1063.2
20 sma at 1060.8 roughly,
1 hr chart 50 sma at 1063.2
20 sma at 1060.8 roughly,
Thanks for the posts Bruce.
I'll leave you alone to gets some rest up for tomorrow.
I'll leave you alone to gets some rest up for tomorrow.
Emini Day Trading /
Daily Notes /
Forecast /
Economic Events /
Search /
Terms and Conditions /
Disclaimer /
Books /
Online Books /
Site Map /
Contact /
Privacy Policy /
Links /
About /
Day Trading Forum /
Investment Calculators /
Pivot Point Calculator /
Market Profile Generator /
Fibonacci Calculator /
Mailing List /
Advertise Here /
Articles /
Financial Terms /
Brokers /
Software /
Holidays /
Stock Split Calendar /
Mortgage Calculator /
Donate
Copyright © 2004-2023, MyPivots. All rights reserved.
Copyright © 2004-2023, MyPivots. All rights reserved.


