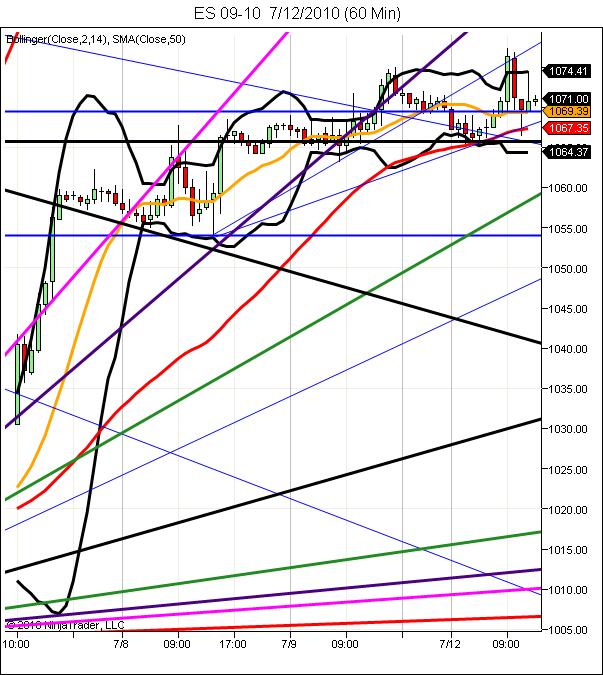
ES short-term trading 7-12-10
must be a Monday in the summer.
Just my opinion...
Market has had two tight range days, CASH SPX put in an NR14 on Friday,
this kind of a condition often leads to a big move, but 75 is 50% of last month's RTH range and 75 was last week's High print
Prints with 76 handle meant (to me) that shorts are covering,
First Price moves above a level like 75 can ultimately succumb to hesitation, then a retrace to establish whether there are additional buyers below before a valid break to upside can unfold.
yes...it's probably easier for u candle folks
Originally posted by wvalen28
Originally posted by BruceM
here comes breakout try three for them....us shorts need them to fail on this one again so they can go fill in all the air etc below..$ticks still weak
just curious, can you see air pockets if using candlesticks?
gap at 71.25 in data.....no shorts until that fills in
that is a crappy low but that gap is causing me conflicts...we need one to resolve first...hopefully that gap in data gets cleaned up first
Bruce,
why crappy low. because only 1 bar showed some counter move size?
why crappy low. because only 1 bar showed some counter move size?
it's a double bottom on the 5 minute ....double bottoms show no long side impulse...and no rush to get long...they get tested often! not perfect though but if you get a good short and 71.25 has traded they SHOULD go to clean that up and test it....poor volume today...
short small at 73.50..concern is the 75 area again and breakout from low range 15 minute bar
Either way.
Dark black horizontal 50% retrace line of last leg down(1065.75). Blue horizontal open (on my chart) regained and holding so far. Note the 1 hr. 50 sma(red line and recommend on any time frame traded), pierced today but not yet broken and still uptrending(but it can uptrend thru price).
Exhaustion pattern? Maybe , but everything looks strong so far. Another long green bar on hourly would add to the more lift case.Right now a lower high and the open,support levels.Also note where the hr bar closes. Oops, closed low(<50%)and touched off the Bollinger bands.
.
I got stopped out when that 15 minute outside bar formed to the upside....reshorted for the low range 15 minute bar high as that was suppose to be the original target...
68.75 is critical...if we get below that ( which is slightly under the low of the low range 15 minute bar) then they will try to clean up that double low...
so for mme the bounds are now 73.75 - 75 and below 68.75...consoldidation day.....earnings begin
68.75 is critical...if we get below that ( which is slightly under the low of the low range 15 minute bar) then they will try to clean up that double low...
so for mme the bounds are now 73.75 - 75 and below 68.75...consoldidation day.....earnings begin
a better view of consolidation can be found on the 30 minute chart !!
True. I have one open. I'm looking more for pattern. I don't even use volume. 11 minutes left in that next hr bar.
Emini Day Trading /
Daily Notes /
Forecast /
Economic Events /
Search /
Terms and Conditions /
Disclaimer /
Books /
Online Books /
Site Map /
Contact /
Privacy Policy /
Links /
About /
Day Trading Forum /
Investment Calculators /
Pivot Point Calculator /
Market Profile Generator /
Fibonacci Calculator /
Mailing List /
Advertise Here /
Articles /
Financial Terms /
Brokers /
Software /
Holidays /
Stock Split Calendar /
Mortgage Calculator /
Donate
Copyright © 2004-2023, MyPivots. All rights reserved.
Copyright © 2004-2023, MyPivots. All rights reserved.
