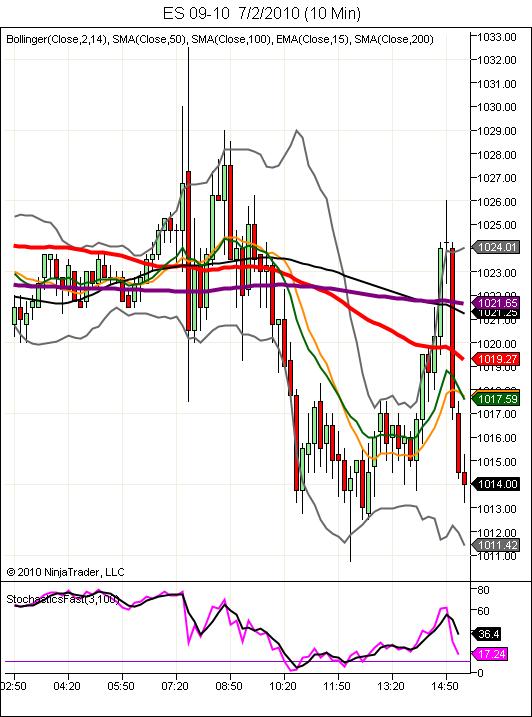
ES short term trading 7-2-10
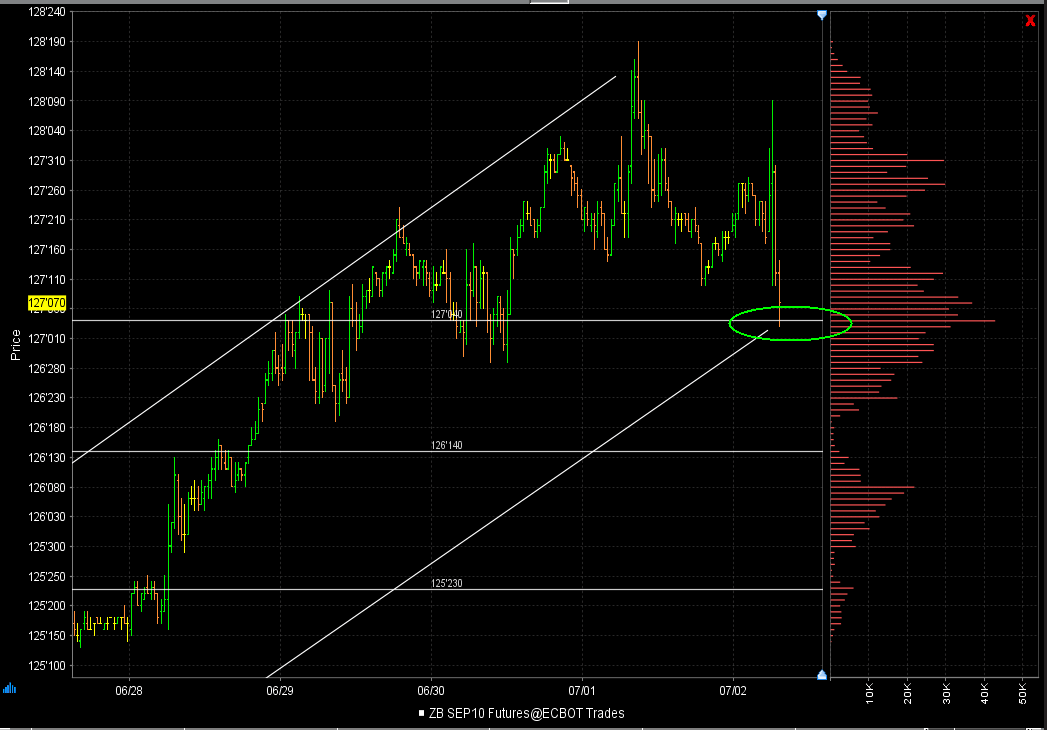
here's a picture of the 30yr bonds:
There is a significant weekly VPOC and uptrend line providing the bonds w/ support.
ES will likely chop around sideways until this support in the bonds is broken. (30yr bonds and ES move inversely to each other)
key numbers today for ES:
1030 - 1032: YDay's O/N hi and today's pre-NFP hi
1022 - gap fill (should be support at least initially)
1017-1018: signifiant support from yesterday's reaction
since we couldn't close above 1026 yesterday, the reversal action yesterday is suspect, and sellers will want to test that today.
David, my question for you is how do you synthesize all those time frames to take an entry ? which is more relevant etc.....
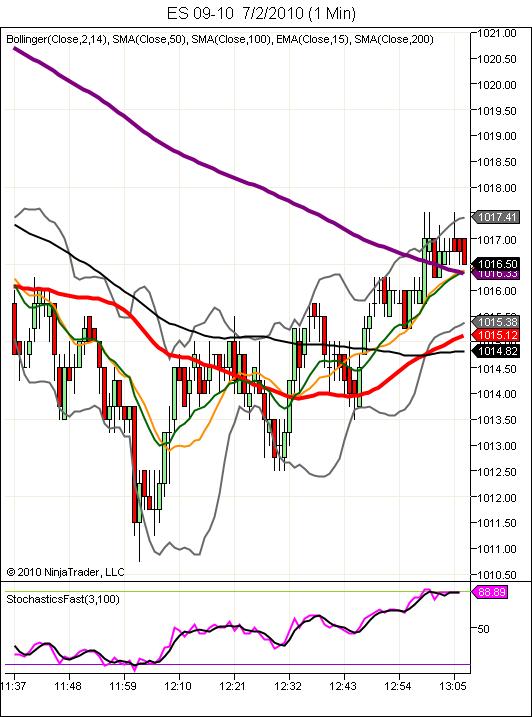
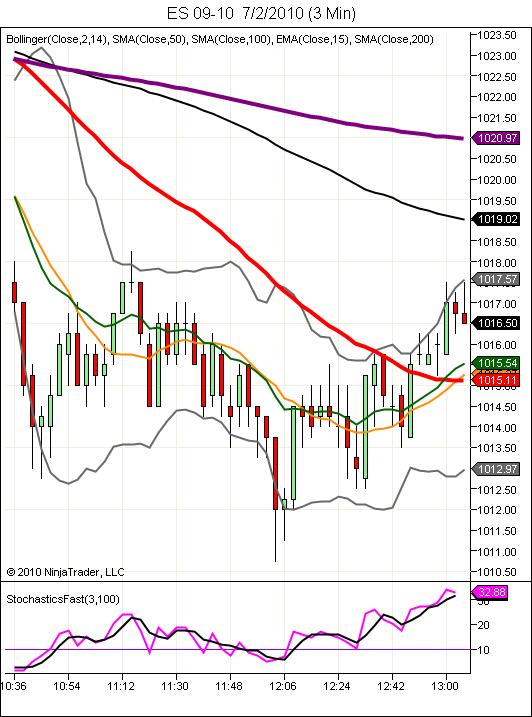
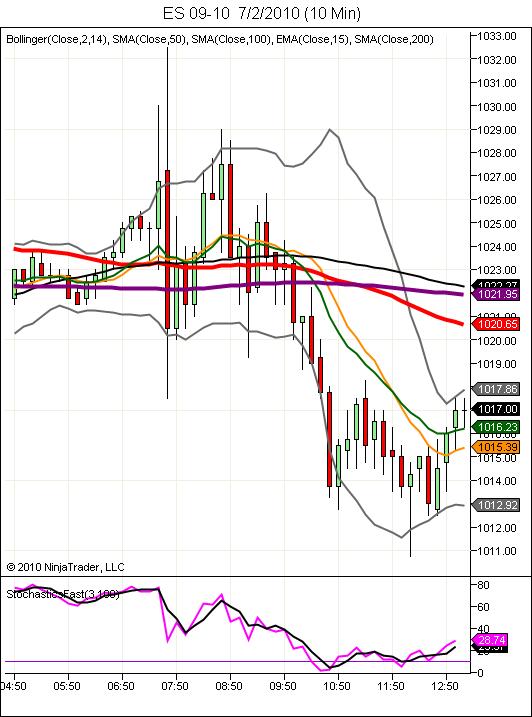
depends on the type of day we're having, but usually intraday i synthesize my method within the big picture of the hour as I watch it develop on the smaller time frames.More charts to follow.
I see it. Not everyone does. I also primarily operate off pattern recognition. Throw in some indicators and fibs.
Most entries are absolute. I think I posted one yesterday. If it's not doing what I thought I'm out. I remember it was after your entry near the lod. I was in about 1009 something with breakeven stop and target of 1012. Never got stopped out and my internet connection went down. I'm not looking for the tops and bottoms for precision but to jump on and off the train as pattrns develop depending on the time frame. It works for me on all time frames. Fractal method.
I didn't mean to sound "short" with ya David......a bit rushed today...I like the concept of looking at longer time frames and drilling down to smaller ones for the exit........
1014.50 was where two low range 15 minute bars formed Yesterday....and TODAYS lowest so far...interesting chart point...not trading since that hour run and just babbling ...
1014.50 was where two low range 15 minute bars formed Yesterday....and TODAYS lowest so far...interesting chart point...not trading since that hour run and just babbling ...
Originally posted by DavidS
I see it. Not everyone does. I also primarily operate off pattern recognition. Throw in some indicators and fibs.
I type slow btw. I was amazed how much posting is done here intraday with charts. I'll try to speed it up if I can.
I welcomed the inquiry. Entries and exits could be made on all of those charts with same method if you know Bollinger Band methods.
Whose gonna hold this stuff over the weekend?
End of day. Note how the 50 ma was still downtrending in that lift. Note the piercing at the top of the bands.
I guess the larger timeframes are most important and I trade inside their context using the smaller timeframes. Like boats, always give the right of way to the larger vessel vessel that is slower to change course.
I guess the larger timeframes are most important and I trade inside their context using the smaller timeframes. Like boats, always give the right of way to the larger vessel vessel that is slower to change course.
Emini Day Trading /
Daily Notes /
Forecast /
Economic Events /
Search /
Terms and Conditions /
Disclaimer /
Books /
Online Books /
Site Map /
Contact /
Privacy Policy /
Links /
About /
Day Trading Forum /
Investment Calculators /
Pivot Point Calculator /
Market Profile Generator /
Fibonacci Calculator /
Mailing List /
Advertise Here /
Articles /
Financial Terms /
Brokers /
Software /
Holidays /
Stock Split Calendar /
Mortgage Calculator /
Donate
Copyright © 2004-2023, MyPivots. All rights reserved.
Copyright © 2004-2023, MyPivots. All rights reserved.
