Crude oil 5896
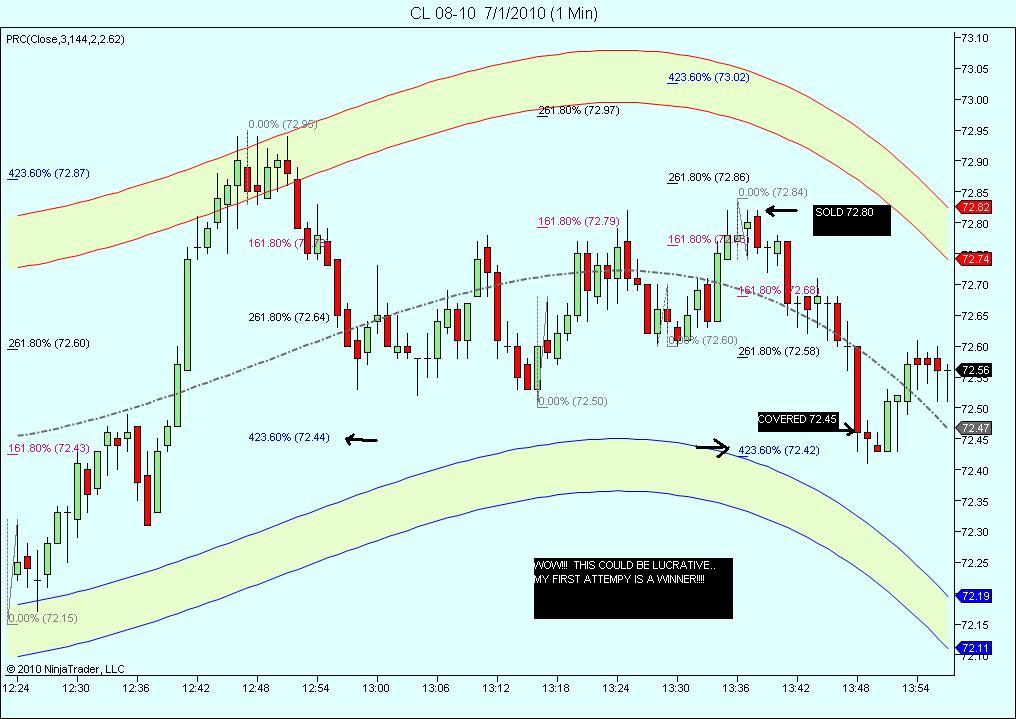
Great start KB. That's what I was talking about. :-)
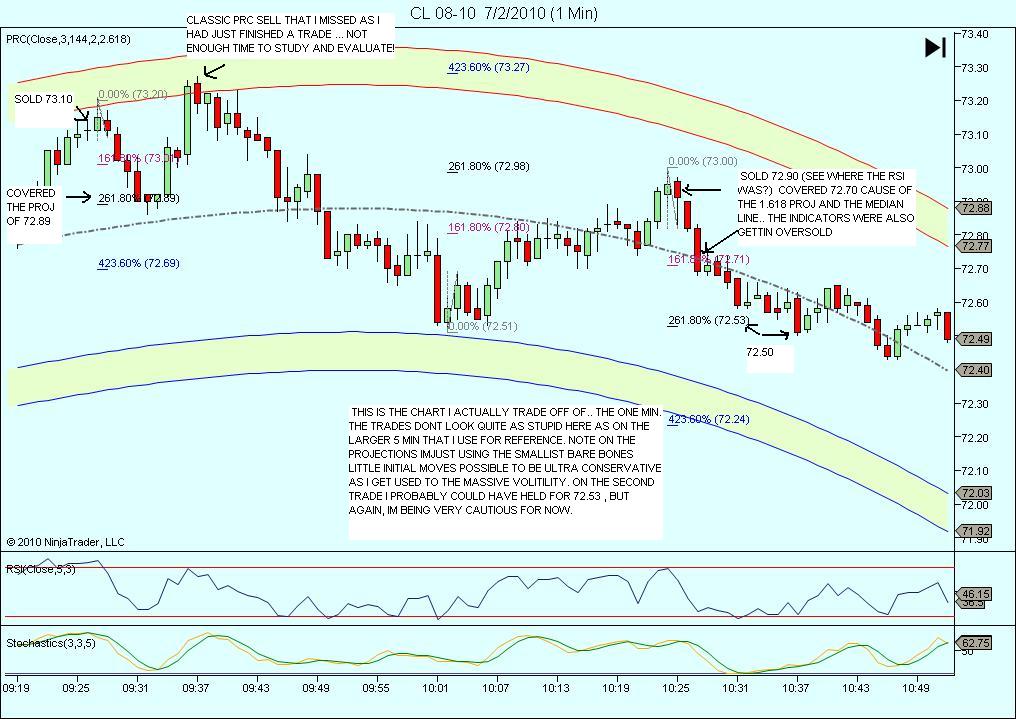
Nice one Kool.What made you sell up there?
What strategy or indicators are you using? This set looks very promising.
Thanks,
Jack
Thanks,
Jack
Originally posted by sjzenofriend, if you open up the chart, you will see more... the projections were fairly obvious and the one min chart (not shown, confirmed the short term peak around 72.85. the 5 min rsi(5 period), not shown also was very overbought so i jumped in on a short...my one min chart showed the decline would go to 72.64, so i bailed a little in front of it at 72.70 for my exit. Same techniques as i have used on the es for years.
Nice one Kool.What made you sell up there?
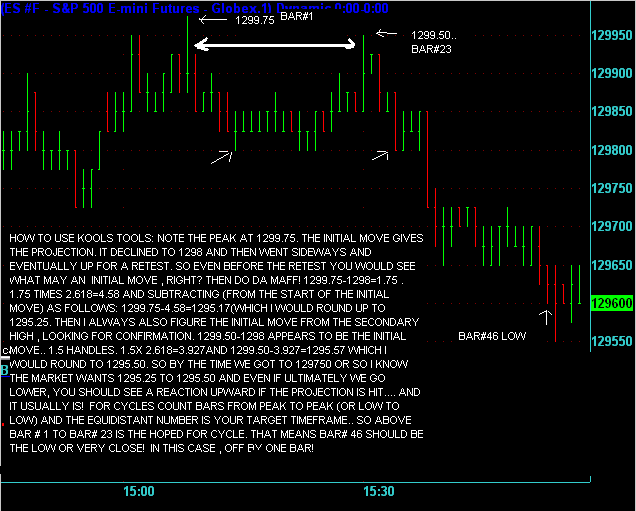
Originally posted by jgreeneMan, that would take a while to explain ,Jack, but basically my price projection method, using rsi (5 period) and stochastics (3,3,5) as confirming indicators... maybe this will help...
What strategy or indicators are you using? This set looks very promising.
Thanks,
Jack
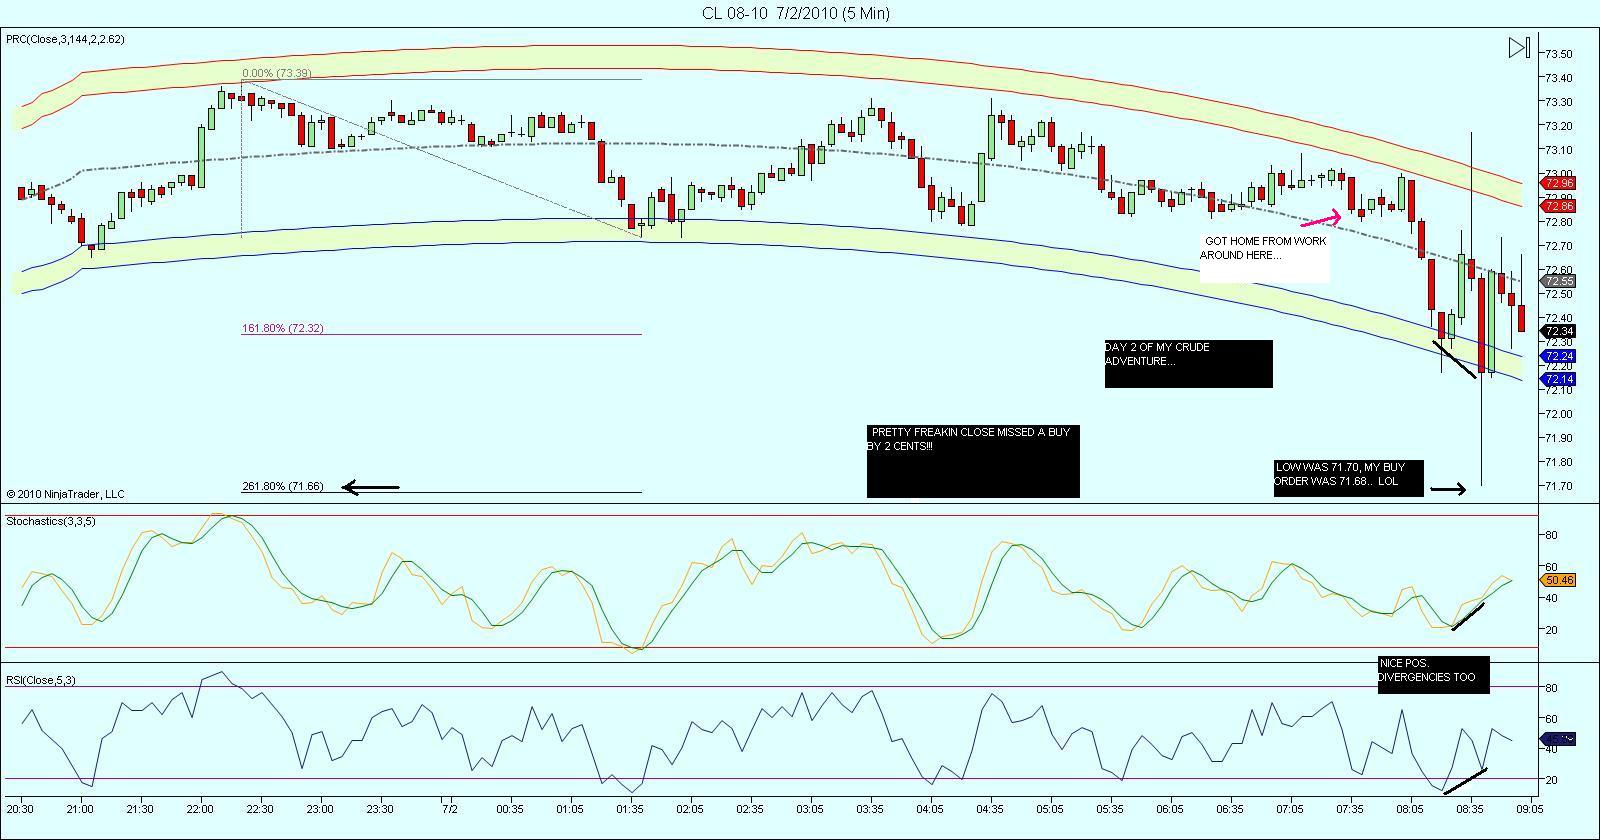
day #2.. look at the 'monster trade' i just missed early by 2 frekin pennies!!!!....
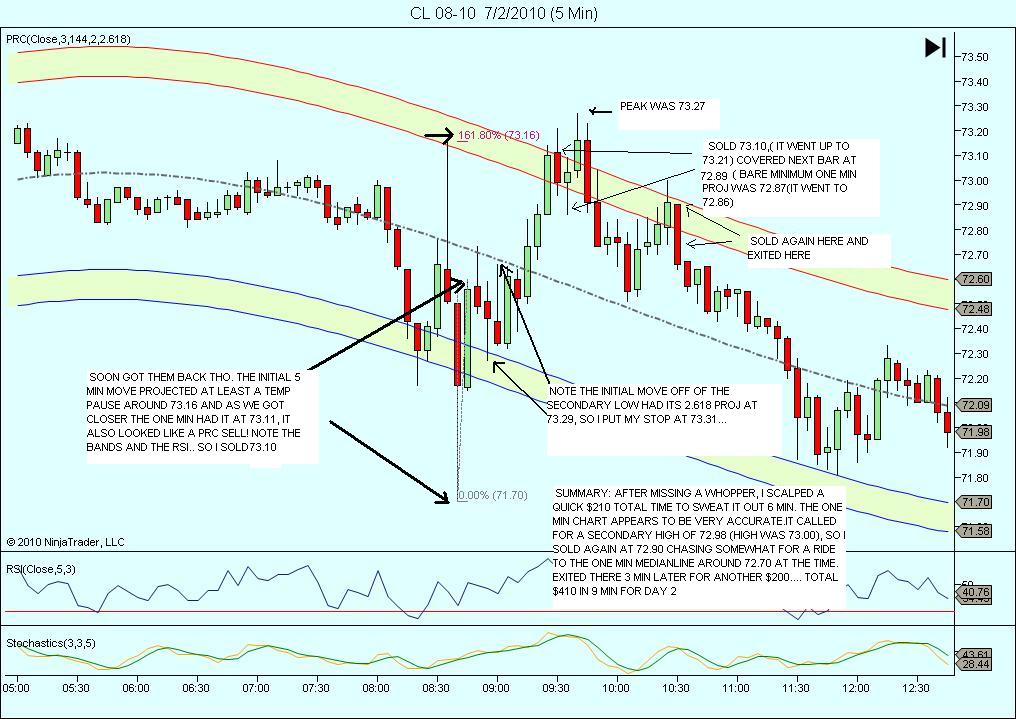
...BOTTOM LINE , still feeling my way ,but off to a good start.. 3 trades in 2 days ,all winners for over 800 bucks total...this market is a goldmine!lol
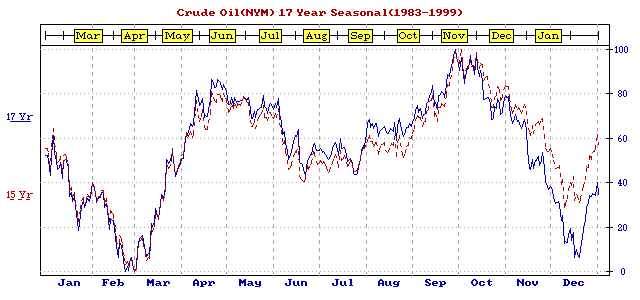
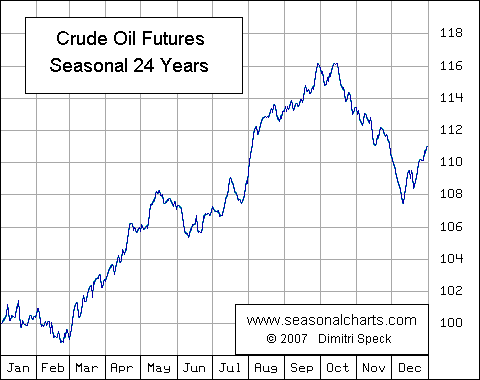
If you want to trade the mud ,you have to start here...with the seasonals:
Emini Day Trading /
Daily Notes /
Forecast /
Economic Events /
Search /
Terms and Conditions /
Disclaimer /
Books /
Online Books /
Site Map /
Contact /
Privacy Policy /
Links /
About /
Day Trading Forum /
Investment Calculators /
Pivot Point Calculator /
Market Profile Generator /
Fibonacci Calculator /
Mailing List /
Advertise Here /
Articles /
Financial Terms /
Brokers /
Software /
Holidays /
Stock Split Calendar /
Mortgage Calculator /
Donate
Copyright © 2004-2023, MyPivots. All rights reserved.
Copyright © 2004-2023, MyPivots. All rights reserved.
