Long Stock Picks 6-28-10
Here are some of the usual suspects for potential high probability LONG STOCK plays if the overall market indices move up ... whether in the morning ... or at any point that the overall market rallies.
As always, with these being LONG setups, if there's a majority of them that begin to crumble and sell off ... it's an "internal" indicator for what the indices may be about to do for an additional insight into timing and potential trades of the ES etc. short.
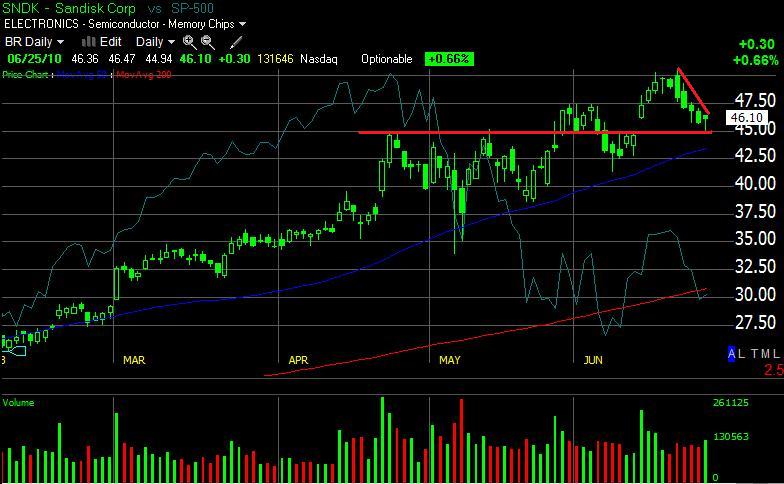
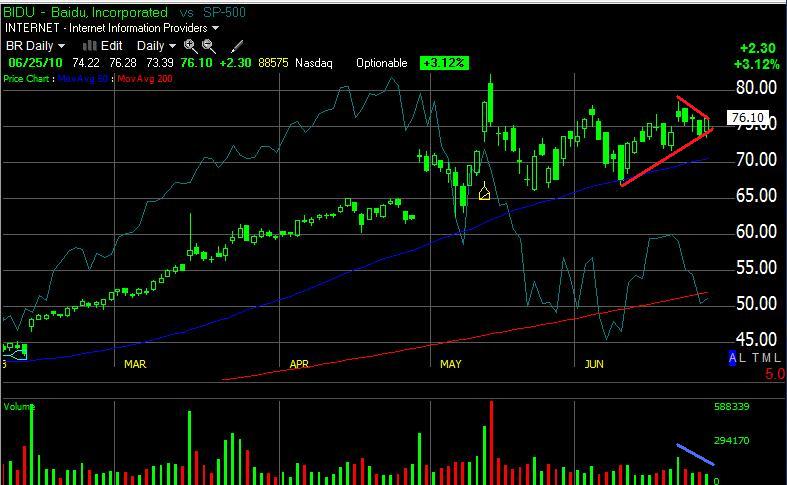
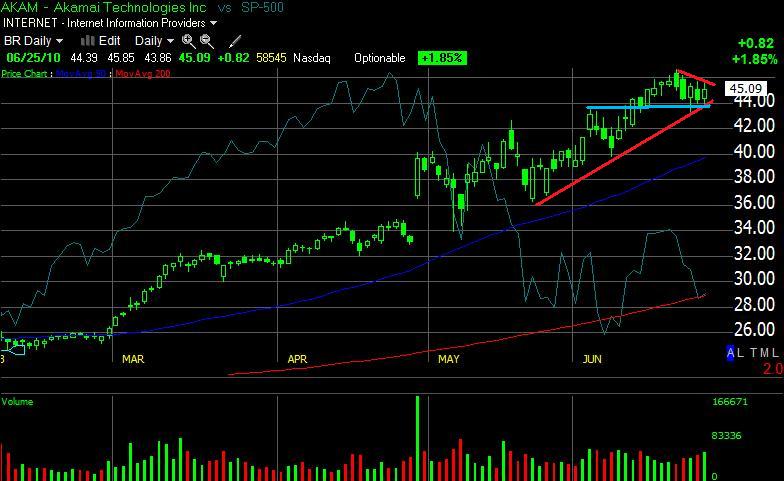
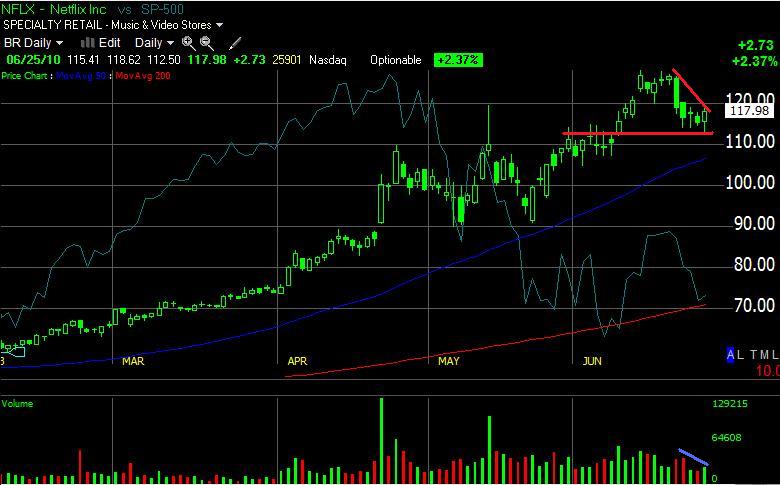
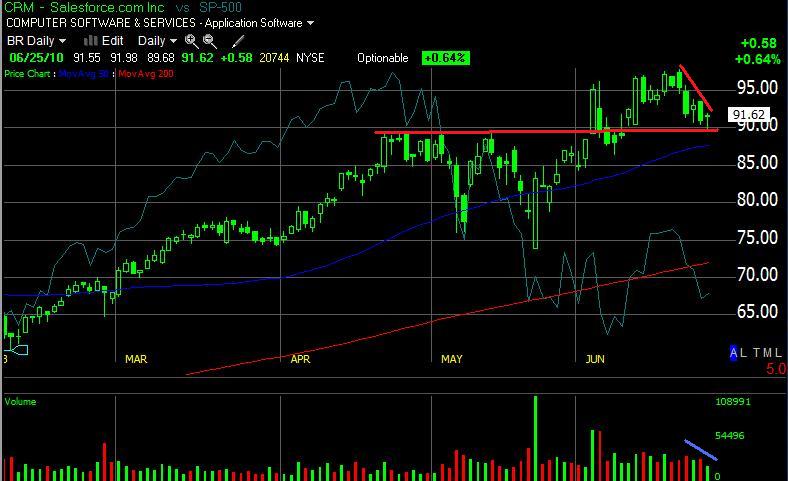
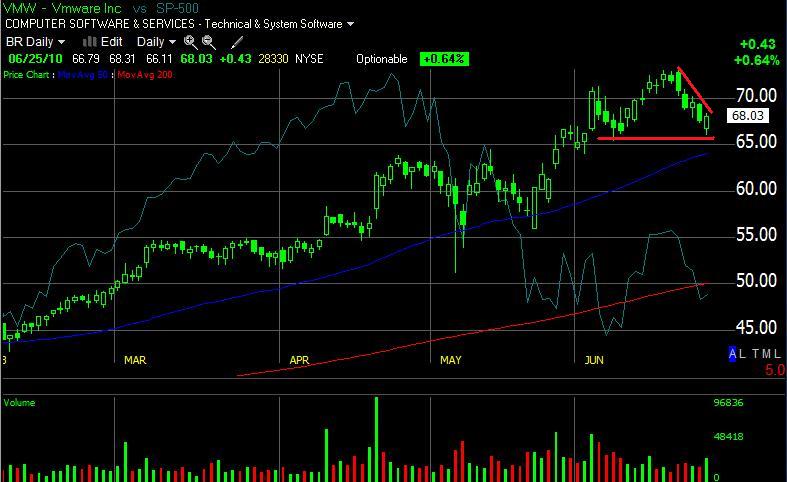
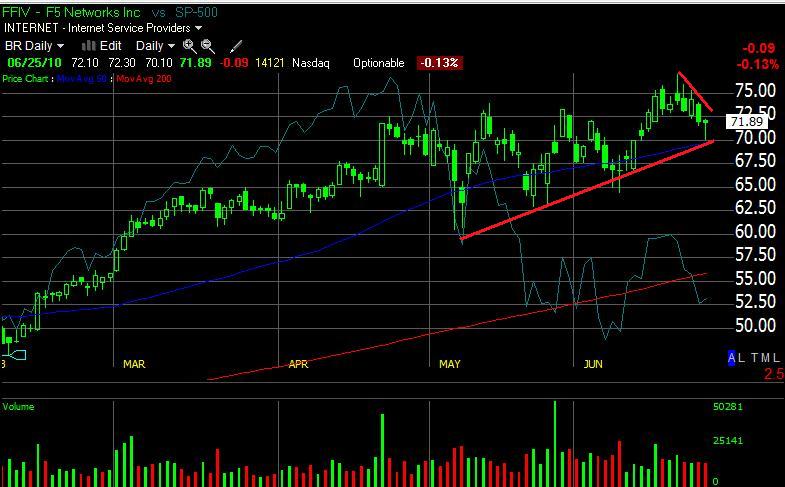
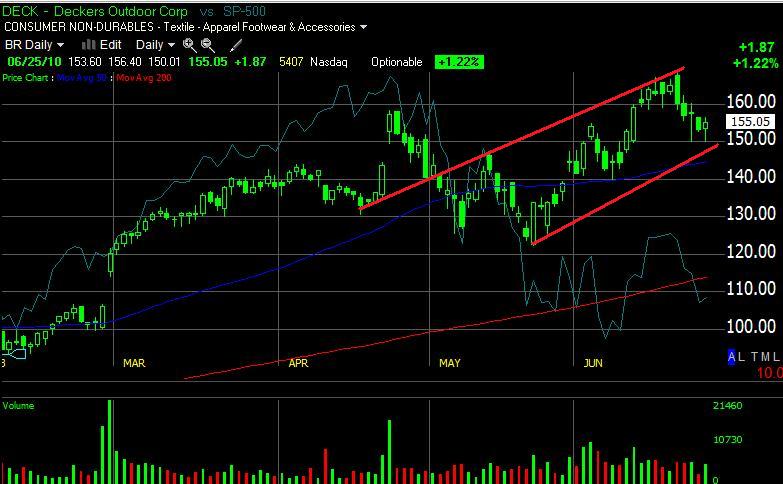
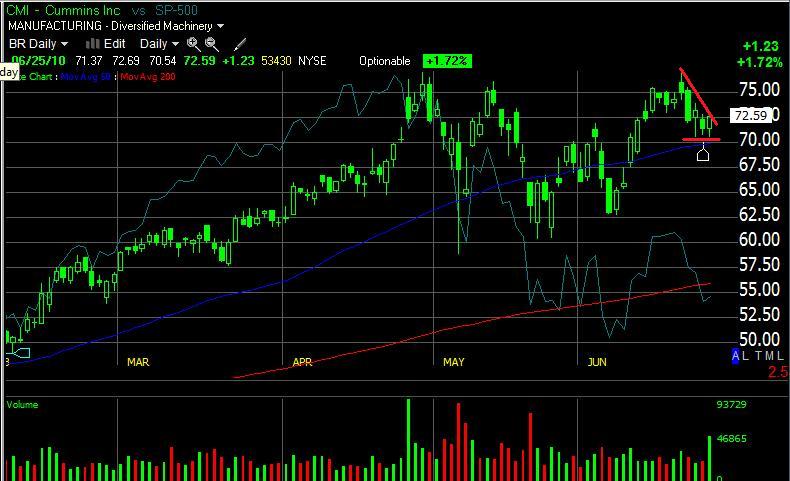
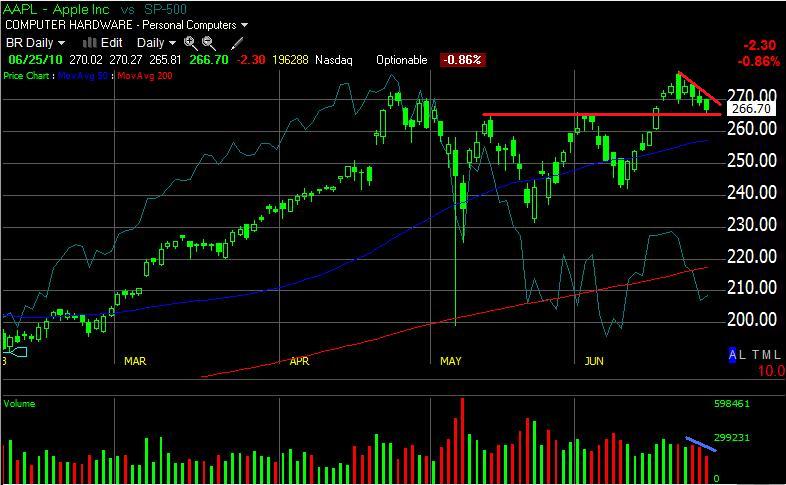
I've divided 'em up into Primary, Secondary and Tertiary groups based on their strength of setups coming from both fundamental (but especially) technical patterns including relative strength to the SP as well as volume. That's what the lines are drawn in for ... which are kindergarten basic and should be self-explanatory upon observation within a nanosecond of viewing the chart(s).
Thought I'd go ahead and post the charts as opposed to just the symbols since that's how I see and communicate and read the markets and stocks. The Red line is the 200 Daily SMA ... Blue line 50 Day SMA ... and the background lighter bluish/grayish line is the SP-500 performance overlaid on each stock chart for a visual feel of how the stock has performed within the past day, week and beyond in relation to the overall market.
I love TC2007 for a variety of reasons but its drawing tools suck @ss for what I'd like to do marking up and carving up these stocks to better convey what I'm seeing. Anyway, you'll see Red lines showing patterns and/or S/R levels with some Cyan lines drawn across volume when there's something extra to point out.
So, saddle up, here they are ... gonna group the LONG PICKS into 3 categories ... with the first being the STRONGEST probability etc.
PRIMARY picks
SECONDARY picks:
TERTIARY (weakest of the long) picks:
AAPL is strong but to me is sketchy with it's daily action and the look of a short term topping pattern - but if the market moves up in a serious fashion, it'll probably follow ... eye on the NQ
AAPL is strong but to me is sketchy with it's daily action and the look of a short term topping pattern - but if the market moves up in a serious fashion, it'll probably follow ... eye on the NQ
Emini Day Trading /
Daily Notes /
Forecast /
Economic Events /
Search /
Terms and Conditions /
Disclaimer /
Books /
Online Books /
Site Map /
Contact /
Privacy Policy /
Links /
About /
Day Trading Forum /
Investment Calculators /
Pivot Point Calculator /
Market Profile Generator /
Fibonacci Calculator /
Mailing List /
Advertise Here /
Articles /
Financial Terms /
Brokers /
Software /
Holidays /
Stock Split Calendar /
Mortgage Calculator /
Donate
Copyright © 2004-2023, MyPivots. All rights reserved.
Copyright © 2004-2023, MyPivots. All rights reserved.

