Current MP Charts
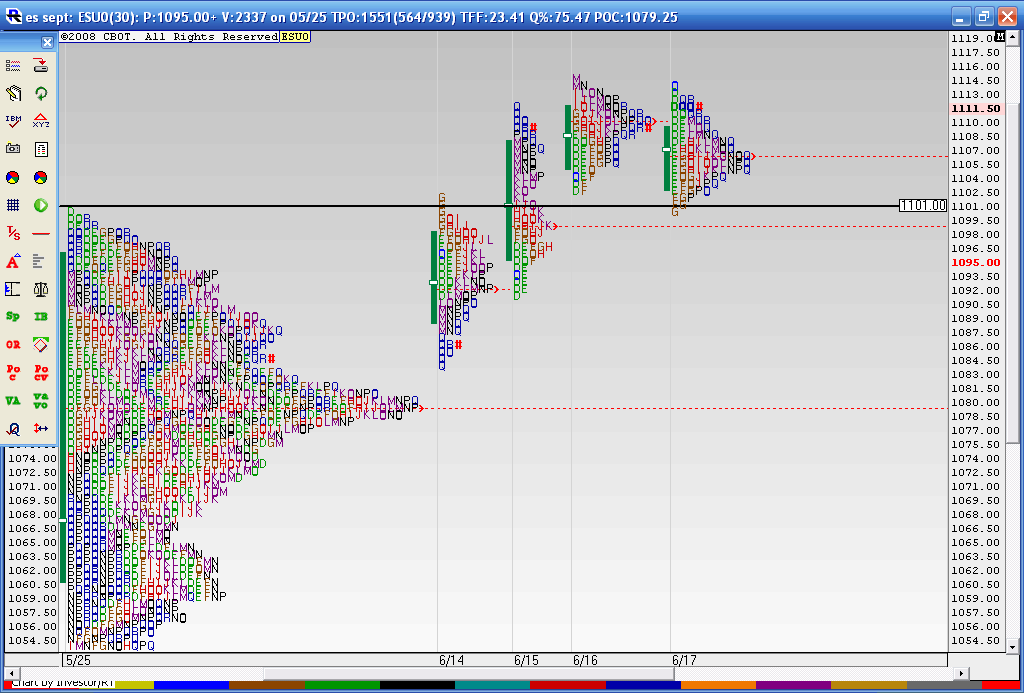
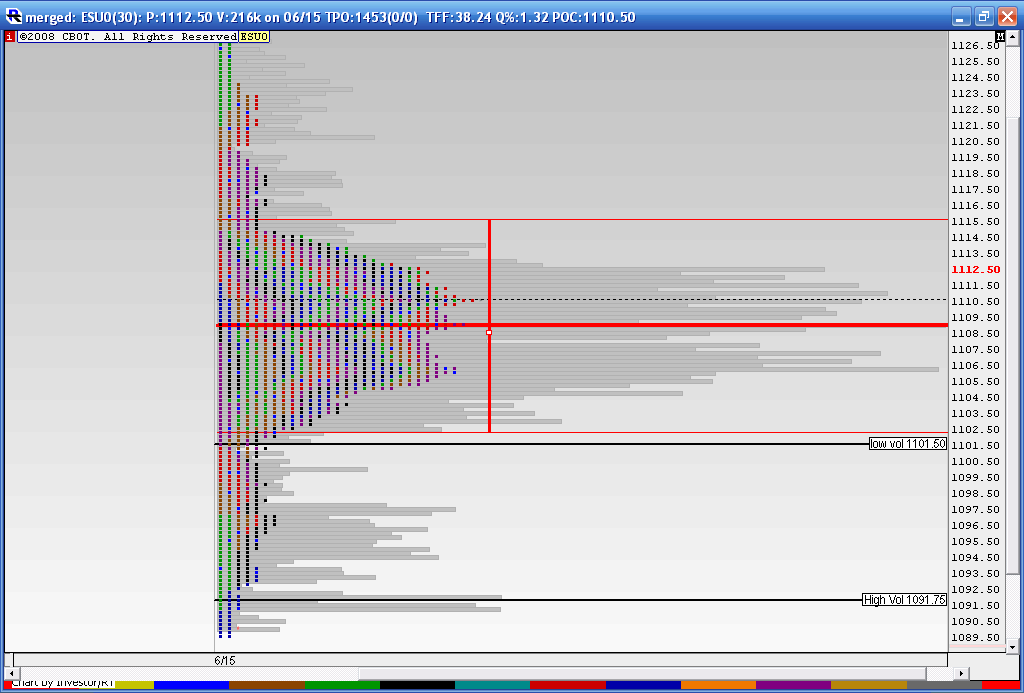
Here is a follow up to a chart I posted. I just don't remember where I posted it..Anyway this shows the Breakout on Monday 6-14 of the composite profile at 1101 and the fact that they held above the big composite node of 1079 - 1080 . Then we went up two more days on 6-15 and 6-16 and today was the first time we had lower price highs and lower Value ( solid green line to the left of the letters). The last three days all have overlapping Value. So we are coiled up and ready to trade for breakouts on Friday.
I also made note of the "bunching " together of the letters in my previous post thinking that a high was in. So I was wrong on that along with all the other cycle folks and market gurus. If this breakout starts to fail then we need to keep a close eye on the breakout point 1101 and of course that high volume node of 1079- 1180. The breakout point was tested today on Thursday and closed just off it's highs. These longer term profiles and my analysis is a work in progress so hopefully this journey will point out some good clues over time. Many are noticing the weakness in Volume and market internals since the breakout of 1101 so that needs to be factored in as we want to know "just how well" we are trending higher. So far I'd have to say not very well!!
I also made note of the "bunching " together of the letters in my previous post thinking that a high was in. So I was wrong on that along with all the other cycle folks and market gurus. If this breakout starts to fail then we need to keep a close eye on the breakout point 1101 and of course that high volume node of 1079- 1180. The breakout point was tested today on Thursday and closed just off it's highs. These longer term profiles and my analysis is a work in progress so hopefully this journey will point out some good clues over time. Many are noticing the weakness in Volume and market internals since the breakout of 1101 so that needs to be factored in as we want to know "just how well" we are trending higher. So far I'd have to say not very well!!
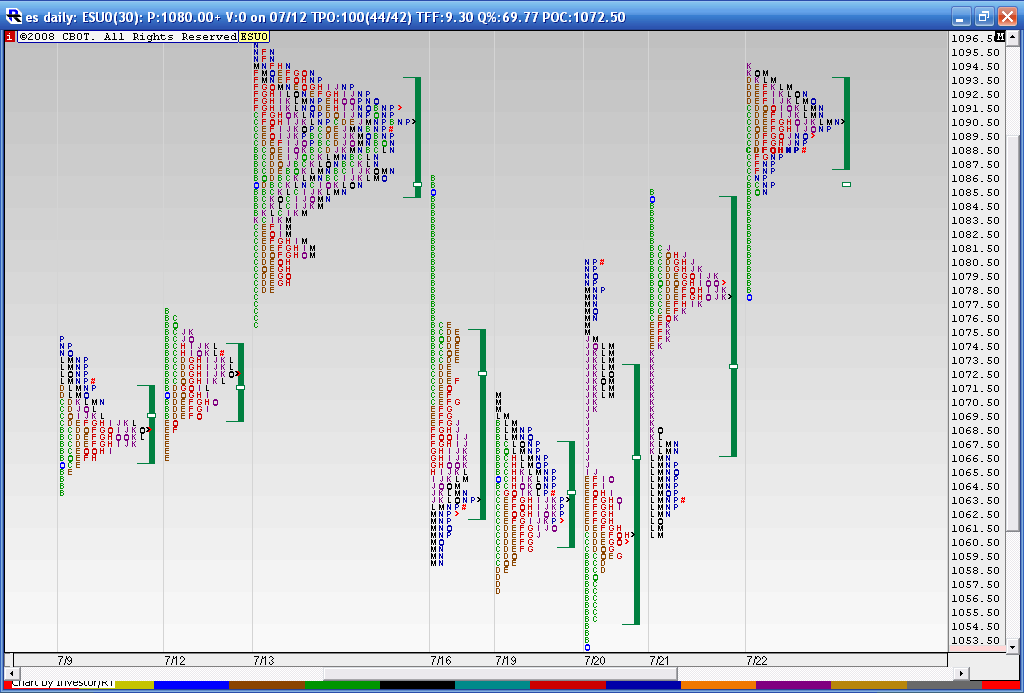
here is the last 4 days merged... big old hunk of volume between 60 and 69
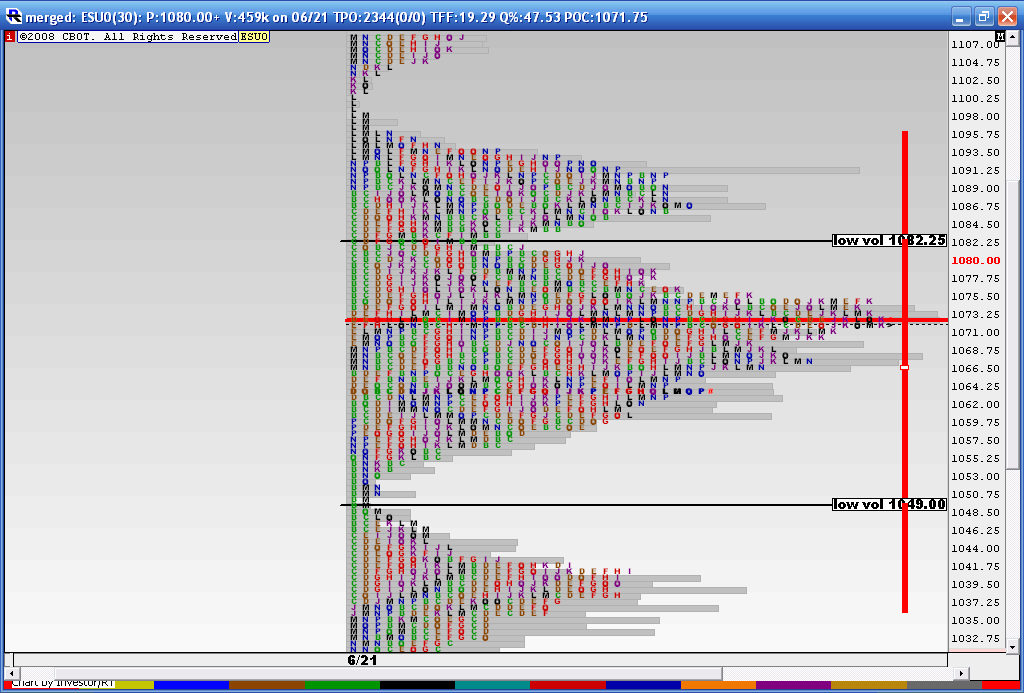
here is part of the merged profile begining on 6-21...I chose that only because it was a swing high...we still have 73 - 75 as the POSSIBLE short or long switch. I thought todays consolidation, before the selloff
was going to lead to new highs as we spent lots of time above that 73.50 price...now that we closed below that I think differently.
The market will try to fill in some of these Low volume areas soon and we should be watching that HV area to give us an idea.
So if I was able to hold contracts I would be trying to get the 1050 retest or if I thought I had a good long I'd try for the 82 area
The obvious question is "what is a relevant time period to merge ?" I don't have the answer yet but I seem to gravitate towards merging consolidations and overlapping days of value...I can't make sense out of the longer term merged profiles....YET!!
For now I like that 73 - 75 as a key area to watch...ASSuming that better shorts will come from being below that and better longs if we are able to get above it
For now I like that 73 - 75 as a key area to watch...ASSuming that better shorts will come from being below that and better longs if we are able to get above it
What does this high volume area, 61-69 tell you? A place of consolidation? Thats what price is doing in the O/N right now.
61 was LOD and Trips are at 70.
Also on that chart you just posted the 76 area shows low volume. From the chart today this area was where the lower IB came in at.
So are you looking to short the higher end of this range or play a break out of this range? If you played a breakout from this range and took the long side, when price came to the low volume area (76) what would you be looking to do there or how would you treat that area?
Thanks for the charts. I'm trying to get my free trial of i r/t going but having technical difficulties !
When i said chart above I was referring to the 4 day merged chart.
Also an idea for the longer term mp t/f's to use.
Maybe break the periods up into different categories.
i.e. Only use MP's from now on, starting from when you believe the bear market started, from a charts perspective, if you believe we are in a bear market. Does that make sense?
My logic is: As the market changes over time so does peoples sentiments and their perception of value, so when we enter a new period, begin a new longer term market profile from the start of that period.
I hope this makes sense, if not, I'll try and explain again.
Please critique this as I think it might be helpful and since I do not have MP charting software at the moment I have no way of visually displaying my idea.
SJ,
This makes great sense.
I was initially gonna suggest MP's for months, for quarters and probably the month of January as it is the opening salvo for the year.
But putting it in terms of peoples sentiment and how they change over time as the perception changes is an awesome observation.
I think you might be hitting on where MP can overlap with something like elliot wave.
Just food for thought.
Originally posted by sjzeno
When i said chart above I was referring to the 4 day merged chart.
Also an idea for the longer term mp t/f's to use.
Maybe break the periods up into different categories.
i.e. Only use MP's from now on, starting from when you believe the bear market started, from a charts perspective, if you believe we are in a bear market. Does that make sense?
My logic is: As the market changes over time so does peoples sentiments and their perception of value, so when we enter a new period, begin a new longer term market profile from the start of that period.
I hope this makes sense, if not, I'll try and explain again.
Please critique this as I think it might be helpful and since I do not have MP charting software at the moment I have no way of visually displaying my idea.
points well taken on time frames etc...there is a thread on MP by someone named BOLTER on Elitetrader.com. He discusses time frames and what he was doing...I think you will enjoy it if you haven't already read it. A few years back...do a search on him..
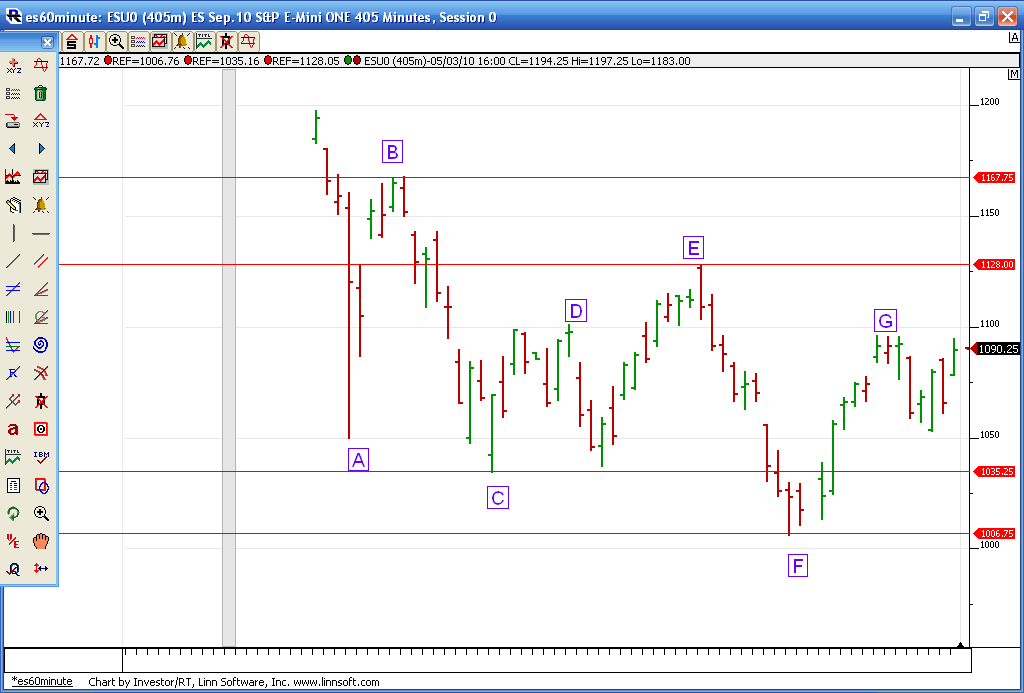
Here is a daily bar chart..When you see my Bigger composite, you are looking at May 25th forward which is Point "C" on this chart. Thought it might be good to have some non-market profile context...I'll be more than glad to try different merges and see what it shows...just tell me what letters or date etc...
It seems that the smaller composites are of more Value ( pun intended) to me as a day trader as the show better S/r area for me and they don't seem to contain as many high and low volume areas...
from my above chart...look at point E.....there were 5- 6 days where price overlapped so that would be a good area to merge the profiles and see what shows up..
Now this I think is useful , it is that area I mentioned up at letter "E". We have the High Volume at 1091, we have the low Volume and the Va low in the 1001- 1002 area, the High Volume at the 1009 area and the Va high at 1015. Couldn't get letters as it is just too big. It also shows a nice Bell curve with out all the HOLES like I get with much longer merges...so this I believe will be the key barrier to upside progress.
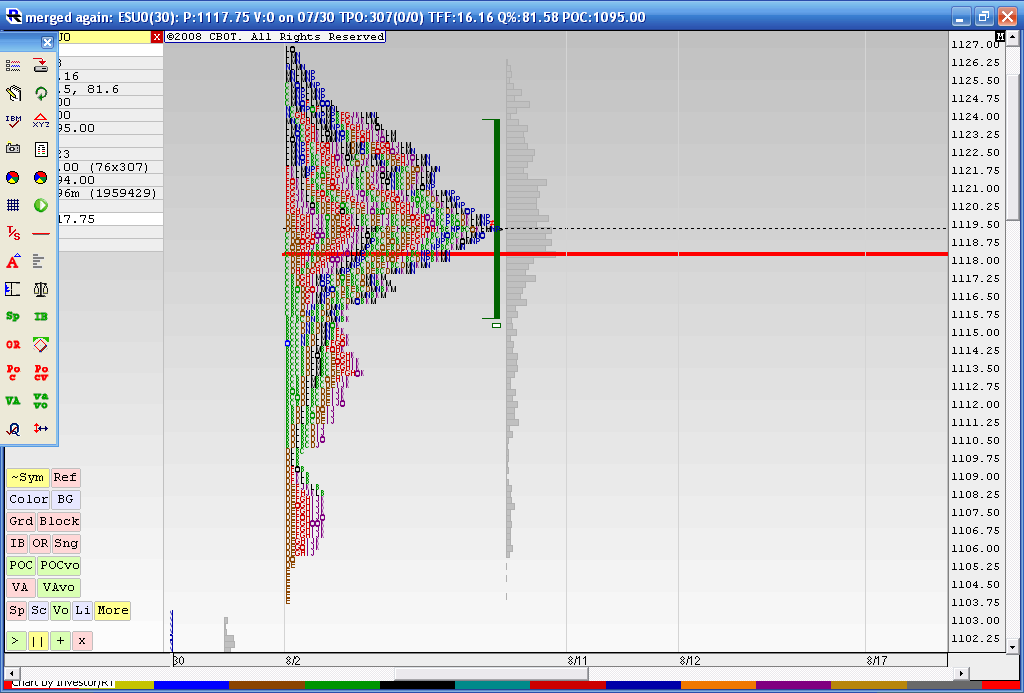
a look at what is trying to hold us back as we travel higher...this is the merged profile from 8-02 thru 8-10
Emini Day Trading /
Daily Notes /
Forecast /
Economic Events /
Search /
Terms and Conditions /
Disclaimer /
Books /
Online Books /
Site Map /
Contact /
Privacy Policy /
Links /
About /
Day Trading Forum /
Investment Calculators /
Pivot Point Calculator /
Market Profile Generator /
Fibonacci Calculator /
Mailing List /
Advertise Here /
Articles /
Financial Terms /
Brokers /
Software /
Holidays /
Stock Split Calendar /
Mortgage Calculator /
Donate
Copyright © 2004-2023, MyPivots. All rights reserved.
Copyright © 2004-2023, MyPivots. All rights reserved.
