Es short term trading 6-09-10
If we can hold back any decline into 52.50 then we have a chance at seeing 84.50 and soon..we have lots of numbers there as of this writing.
Above yesterdays high and RAT we need to get past that 68.50 and 70. We naturally be a break out of the Monday - Tuesday Range.To go get 84.
The R1 and R2 levels match up with the RATs so those become more important. You can see how we consolidated at 75 - 76 so be careful there. Just because we think we are on track to go get that 84 volume area doesn't mean it will be easy.
Quick summary so far
61 - 63 Rat and O/N high so far
56 Rat and that key spike bars low..and Weekly MIDPOINT ******
50 - 52 Rat , VPOC amd POC from Tuesdays range
We have two shelves of support so watching what happens if we get down into the 50 - 56.25 RAT will be critical..
If we get down belwo 44 then we may decline to 38 realy quick. I'm hoping we don't see that today.
Wednesday is a good day for Gap fills..
30 and 15 minute charts made a higher low so that is a good sign.
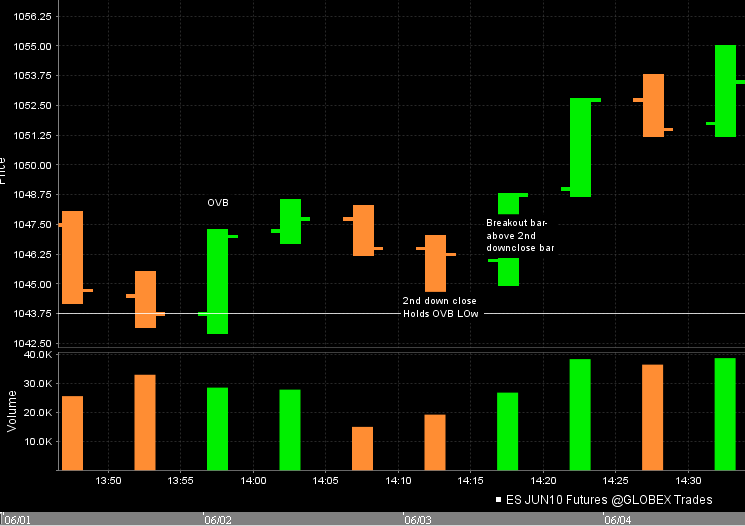
OK , here is a setup I mentioned YD. We had an outside vertical bar (OVB) form on the 5 minute to the upside. That means it traded below the low of the previous bar and then took out it's high. This was right at the 43.75 which is a RAT! we came back to test that OVB and then broke out above the test bars high.
The day profile was showing neutral trading so we expect trade to try and go back to the middle of the range. Here is the chart. You can see more of these in the "Favorite Entry bar" thread.
The day profile was showing neutral trading so we expect trade to try and go back to the middle of the range. Here is the chart. You can see more of these in the "Favorite Entry bar" thread.
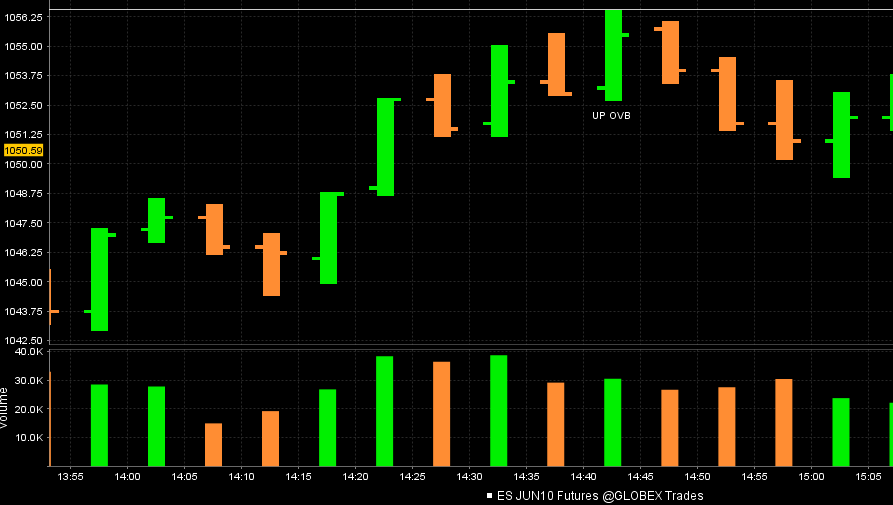
Here is the other thing I mentioned YD. WE rallied almost 14 points off that OVB low in the previous chart and then we get an UP OVB at the highs into our 56.25 Rat followed by an inside . You don't want to buy up OVB's at the highs !!! NEVER! Especially if an inside bar forms after it.
so your OVBs are basically engulfers, a type of reversal candle (where reversal means end of trend, not necessarily reverse of direction)
Basically Feng and WHERE they form and in which direction means a lot....so we want Down OVB's at swing highs and up OVB's at swing lows...not perfect but for those who like entry bars they can be a help if you have a good target in mind
Originally posted by feng456
so your OVBs are basically engulfers, a type of reversal candle (where reversal means end of trend, not necessarily reverse of direction)
Where we open today will be critical. We had a spike close YD which in Daltons world is a run outside of the developing Value area in the last few periods of trade...this run happened from 48 - to the highs
He says that if we open higher above the spike and test the spike high twice in the SAME 30 minute period then we may auction down fairly far into that spike...this would go well if we are trying to trade for the gap fill..in essence he wants to see if the spike high forms support
When we open in spikes we tend to have range trade, like yesterday.
Anyone trying get short up here in the ON?? I think they want to at least test 64..!
Lots of numbers in this 67.50 - 70 area.....no volume at the 64 !! Just an idea...
Originally posted by BruceM
Basically Feng and WHERE they form and in which direction means a lot....so we want Down OVB's at swing highs and up OVB's at swing lows...not perfect but for those who like entry bars they can be a help if you have a good target in mindOriginally posted by feng456
so your OVBs are basically engulfers, a type of reversal candle (where reversal means end of trend, not necessarily reverse of direction)
if you're a trend trader it's a good indication of a trend possibly ending...i.e. a good exit point
30 point range so far this week...I expect 45 points of range.....so half of that is 15 added to the high is 85...( 70 plus 15) subtracted from the high gives us the midpoint 1055 - 1056....(70 minus 15)...
so once you pick a bias then trade for it.....with runners...I suck at holding runners...perhaps u can do better.....85 or 55...one I think will print..
One or both numbers will trade this week.....any guess??? BOTH ?
so once you pick a bias then trade for it.....with runners...I suck at holding runners...perhaps u can do better.....85 or 55...one I think will print..
One or both numbers will trade this week.....any guess??? BOTH ?
im planning on shorting the open.
s 68.25 for 64
Longer term players might want to refer back to the weekend preview and calendar... cycle high today ,working lower into the 14th.. DONT FORGET TOMORROW IS ROLLOVER DAY!...C YA!
Emini Day Trading /
Daily Notes /
Forecast /
Economic Events /
Search /
Terms and Conditions /
Disclaimer /
Books /
Online Books /
Site Map /
Contact /
Privacy Policy /
Links /
About /
Day Trading Forum /
Investment Calculators /
Pivot Point Calculator /
Market Profile Generator /
Fibonacci Calculator /
Mailing List /
Advertise Here /
Articles /
Financial Terms /
Brokers /
Software /
Holidays /
Stock Split Calendar /
Mortgage Calculator /
Donate
Copyright © 2004-2023, MyPivots. All rights reserved.
Copyright © 2004-2023, MyPivots. All rights reserved.

