ES short term trading weekend preview 5-22-10
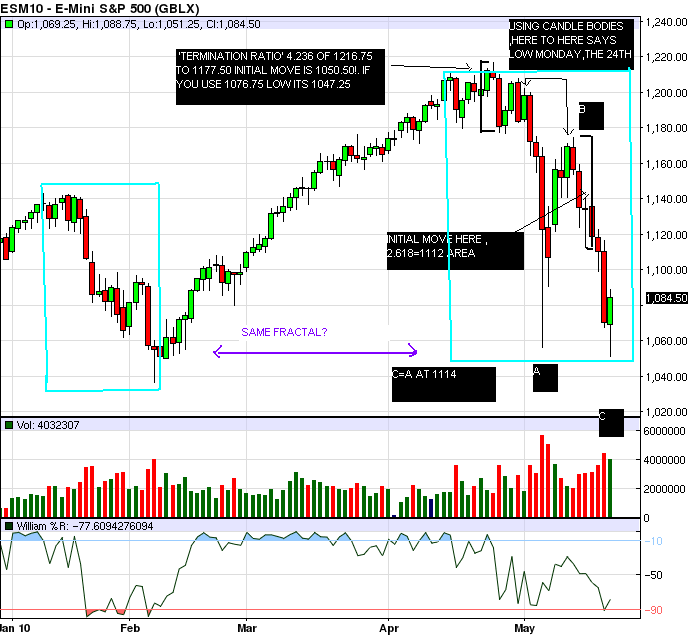
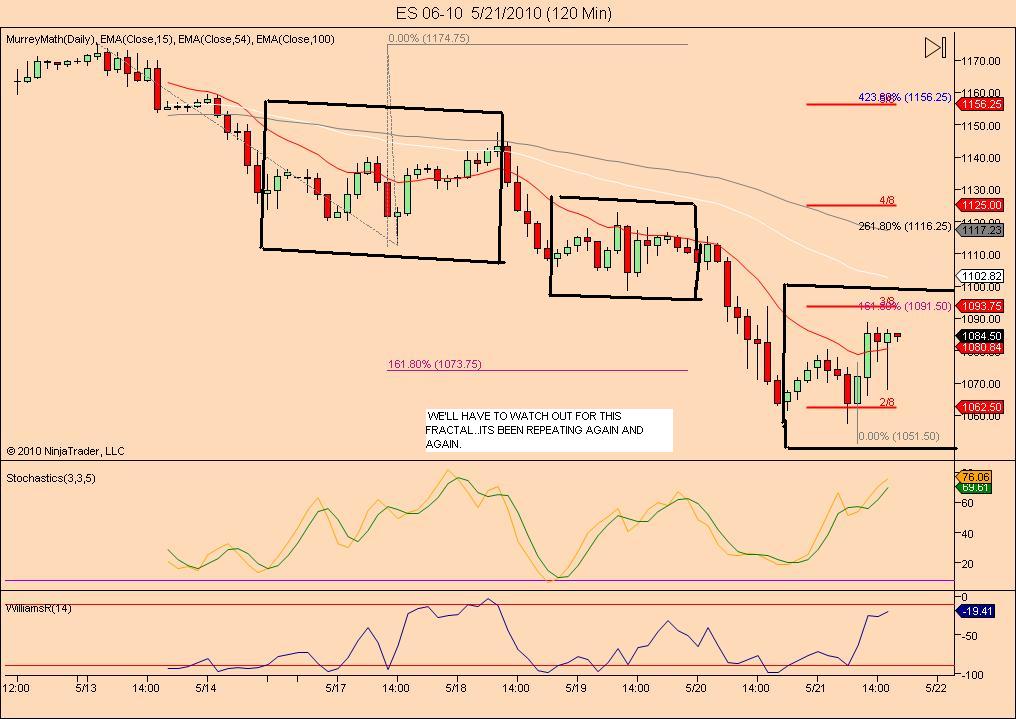
What a crazy end to a crazy week,of a crazy month!... or is it? We've come off a historic rally from a historic bear market. Is it really so surprising that we'd get a stiff 165.5 handle pullback? Thats not even a .382 correction of the entire rally.When i look at the markets bigger picture ,i follow the kiss theory...keep it simple stupid! If you hold the premise that the correction should be an A-b-c then we now have the bare minimum for that in place. A further correction to 1014 or 1003 would have been better(and is still the risk.). Longer term cycles next peak late July or more likely the first week of August (where an even bigger pullback is possible!), so some form of rally is due. When we began the decline off the April top, i was looking for 19th or 24th as likely time frames for a bottom. 1014 OR 1003 would have been better,(and are still the risk!), but we'll have to see what unfolds next week.After all ,if the market is still very bullish,shouldnt the correction lean toward bare minimum expectations? Conditions are ripe(rsi, cpc,cycles,etc)for at least a rally here off of oversold technicals. The fact that everyone is expecting it bothers the hell out of me. I wonder if it will be less than expected!.. as always time will tell.
thanks Kool...I hope u r feeling better!!
Thx, Bruce. Back from the dead! And missed some great action! Missed 1051 (my target was 1047.25) but couldnt even trade.
And for the short term heading into next week: cycles are up into midweek then down into early the next week. I'll hold off on numbers till the daily thread, but,something to watch for...
And of course, DA NUMBERS!: 1151=20 day sma; 1150.50=34 day ema; 1125.25=5 AND 13 MIN 2.618 proj.; 1115.25-1116=Demark wk high and 2 hour 1.618 and hourly 2.618; 1112.75=end of wave 1(can not go above here and still be a wave 4); 1105.50=Demark daily high; 1101.75 hourly air ends; 1099.37=50% retrace 1147.50-1051.25; 1098.50=.382 retrace 1174.75-1051.25; 1098.75 daily air ends; 1093=c=a on hourly chart and 5 min proj; 1090.25-1090.75= .236 (1216.75-1051.25)and hourly 1.618 proj; 1048.75 Big C= Big A if A ended at 1090.75, and 3 std dev. on the 13 min vwap; 1014.50 C=A if A ended at 1056; 1012.50= daily proj from 1174.75...
Summary: This week should be revealing to the bigger picture. The minimum requirements for an abc correction off of the rally highs is deemed in place (tho the daily 4.236 at 1047.25 would have been ideal!). Any move below the Feb low (1036.25 basis June)would portend MUCH LOWER prices. A move above the 1125 projections would be the first clue that the 40 and 90 day cycles have bottomed and new highs are possible. The trend line down is currently around this area. So those are the price parameters. Time wise the minimum is also deemed to have been met with the avg 90 day cycle low due right now! cycles indicate a pop up Mon -Tues then drifting down for a week. Technically, we dont really have the neg divergencies we need yet, so a 'marginal' new low is still possible after a rally to set that up. Good luck!!!
Emini Day Trading /
Daily Notes /
Forecast /
Economic Events /
Search /
Terms and Conditions /
Disclaimer /
Books /
Online Books /
Site Map /
Contact /
Privacy Policy /
Links /
About /
Day Trading Forum /
Investment Calculators /
Pivot Point Calculator /
Market Profile Generator /
Fibonacci Calculator /
Mailing List /
Advertise Here /
Articles /
Financial Terms /
Brokers /
Software /
Holidays /
Stock Split Calendar /
Mortgage Calculator /
Donate
Copyright © 2004-2023, MyPivots. All rights reserved.
Copyright © 2004-2023, MyPivots. All rights reserved.


