ES short term trading 5-20-10
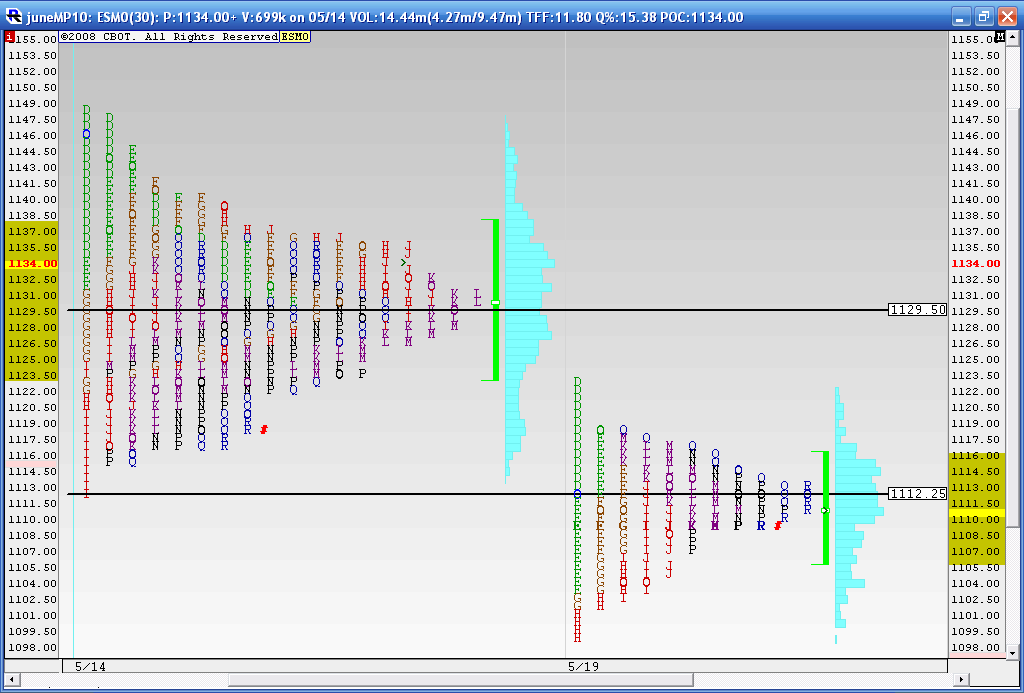
Here is how we shaped up today....we broke below the lows of the composite but then consolidated right at that key low.....seems like tomorrow or O/N will be a deciding factor of direction for this market. A person who was selling this breakdown at the 1112.50 area would not want to see a close like we had today so my bias would be back towards the upside.
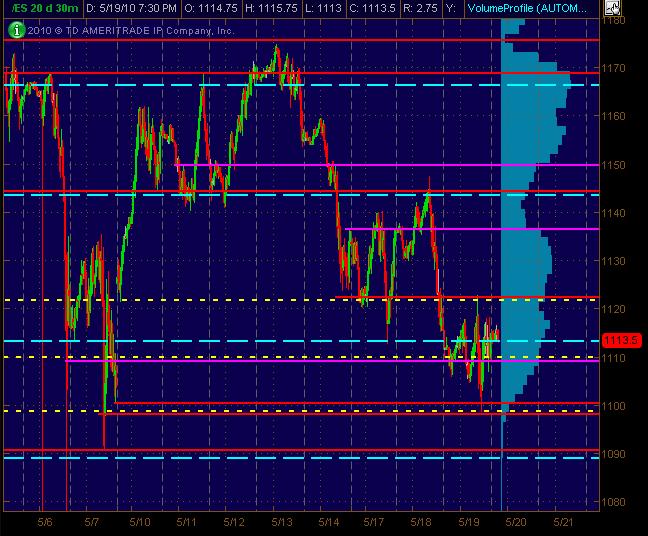
Here's what I've got using a 20 day 30m chart. Yeah, there's a lotta lines on it ... but it's just a map ... and stretched across about 100 SP points.
So, walking it up:
PSAR and Wkly Pvt @ 1090
PSAR and Daily S1 in 1100 zone
Semi-signif PSAR along with Daily Pvt in 1110 zone w/a Wkly Pvt just
above @ 1113
PSAR in 1122 area which is also Daily R2
*also 1130 is another significant inflection point ... and if the mkt runs long on Thurs. could well reach up there. Of course, overnight action may force some re-mapping.
Again, this is just a MAP and we've got option expiration this week. Price movement/action and structure around these areas should dictate how and whether these are reversal areas or a pause that then penetrates one on the way to attempt reaching the other. Hope this is helpful.
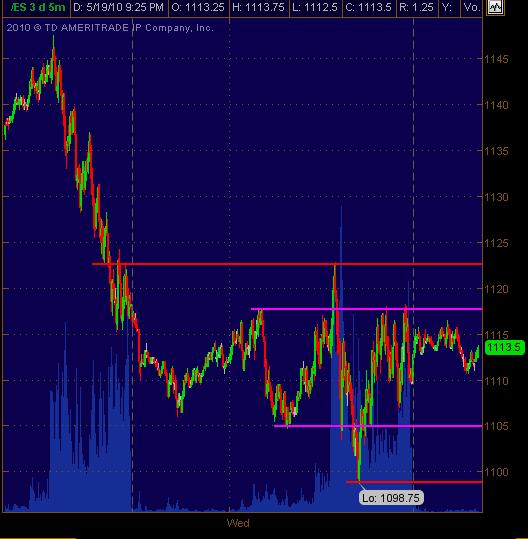
Wanted to also drill down with a 5-min chart of all hour trading for the past 2 days. After a trend down day on Tuesday (have some closer-up S/R levels drawn in) ... we get a chop, sideways day ... much like Don Miller's observations as others have posted here.
Don't have a bias for Thursday. I think Bruce and others will have a better grasp of unfolding expectations and odds with MP describing the market.
Also, wanted to mention ES punched slightly below and rallied back above the daily 200 sma around 1100 fwiw.
Don't have a bias for Thursday. I think Bruce and others will have a better grasp of unfolding expectations and odds with MP describing the market.
Also, wanted to mention ES punched slightly below and rallied back above the daily 200 sma around 1100 fwiw.
1104.50 was a high volume price yesterday and there is an air pocket there in O/N......market is at 1101.....I expect that air to be filled in..FWIW
Trying long from 92.50..I have a key number at 90 and a big air pocket now...
Computers are halting the market again. Watch out
zones I'm setting up
1087 - 90
1100 - 1104.50
1110 - 1113***
1120 -1122
1087 - 90
1100 - 1104.50
1110 - 1113***
1120 -1122
New air begins above 95 so that needs to be a target...I missed the add -on...
combining the daily and weekly s2 numbers gives us our key support zone...in the 90 -87 area
this particular air pocket goes up to 1100...and we still have that 1104.50
this particular air pocket goes up to 1100...and we still have that 1104.50
That zig-zag pattern from yesterday's 24hour PA is a search to unlock volume.
With the PA of yesterday (RTH initial rise rejected), today is RIPE for a DB (this is just pattern recognition on my part, it does not mean it HAS TO happen, unfortunately, a bounce today from a potential DB can run into a brick wall at daily pivot (1110)
Today, potential for a DB is high (IMHO), Problem I have is whether immediate resist is now yesterday Low of 1098.75.
Everyday, I calc .4 * 5 day average True Range (RTH) because of an article I read by Steenbarger: when ES opens beyond .4 times 5 day ATR, there is a larger than norkmal chance of NOT filling gap (but if starts a run up, past the 98 level there should be a classic squeeze).
(calculate .4*5 day ATR and then add and subtract it from the close).
As I have looked at these numbers daily, I have noticed that they often can represent S or R in the AH... coincidentally, today's .4*5dayATR for today is 1098.99 on the downside, (1120.51 on the upside).
1098 handle looks important (even from below).
below 98, the 1090.75 was the 10:30 am swing Low that defined buying interest on 5/7/2010, the day after the flash crash. and that looks like it is being tested,
Px moving faster than I can type
geez, is 1056 going to get tested? Seems so unlikely... but I have noticed that virtually ALL fat finger price extremes get re-visited.
1090-1088 is current support
did anyone see anything in terms of a headline (or euro?) that coincided with break below 98?
Originally posted by johnpr2010
Computers are halting the market again. Watch out
Hey johnpr
What does this mean..
Kool nice prediction you nailed it, man u are good
Emini Day Trading /
Daily Notes /
Forecast /
Economic Events /
Search /
Terms and Conditions /
Disclaimer /
Books /
Online Books /
Site Map /
Contact /
Privacy Policy /
Links /
About /
Day Trading Forum /
Investment Calculators /
Pivot Point Calculator /
Market Profile Generator /
Fibonacci Calculator /
Mailing List /
Advertise Here /
Articles /
Financial Terms /
Brokers /
Software /
Holidays /
Stock Split Calendar /
Mortgage Calculator /
Donate
Copyright © 2004-2023, MyPivots. All rights reserved.
Copyright © 2004-2023, MyPivots. All rights reserved.


