ES short term trading 5-17-10
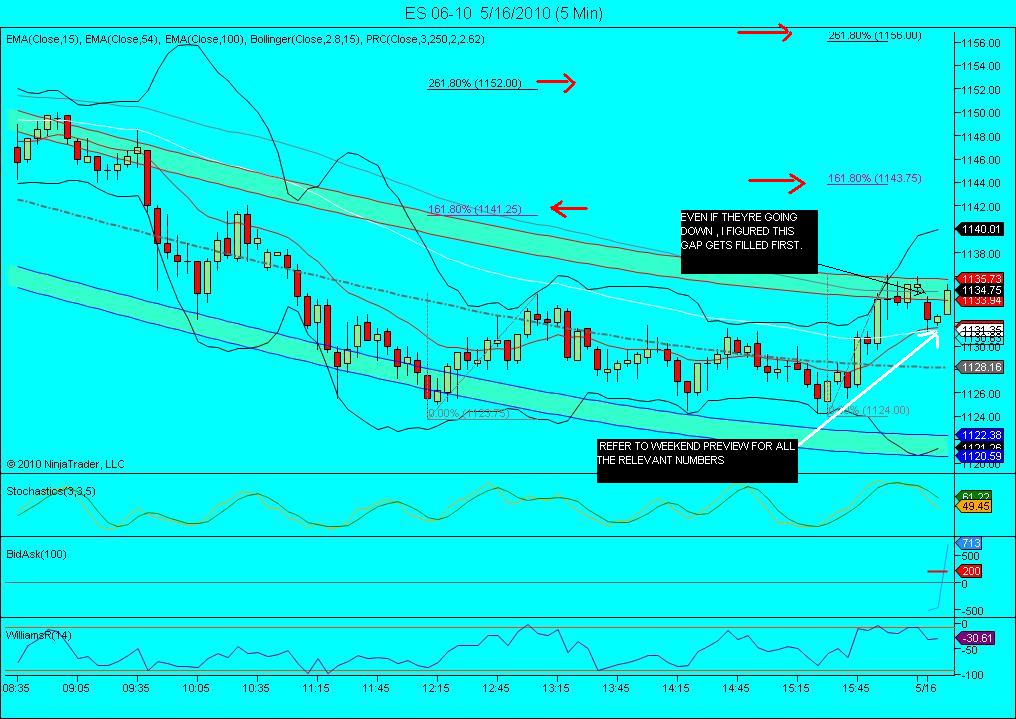
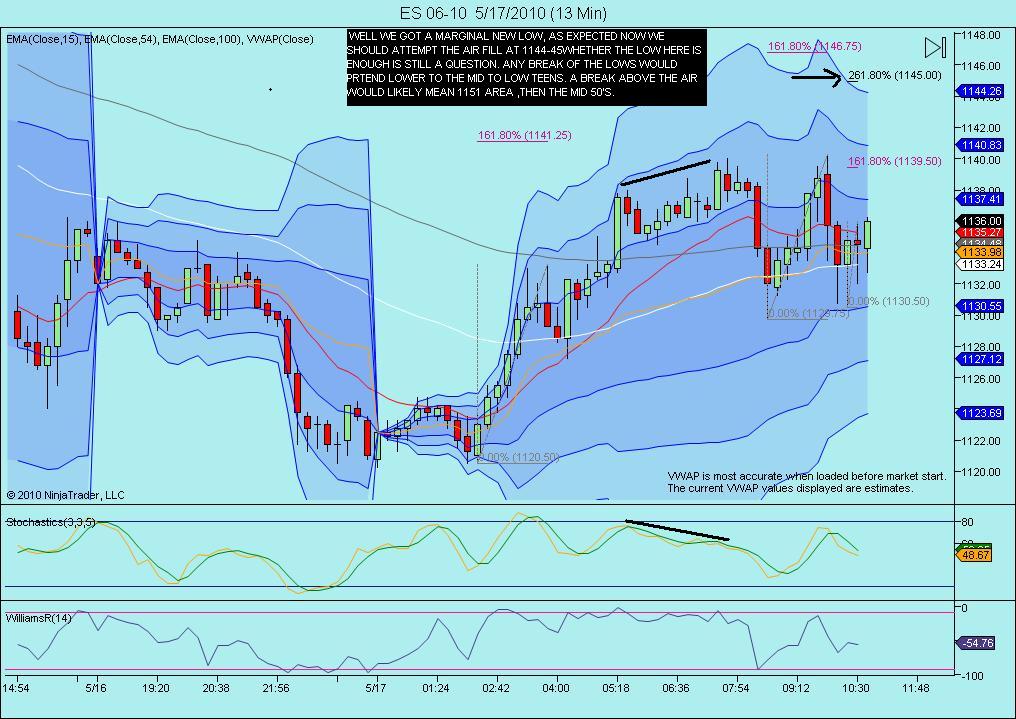
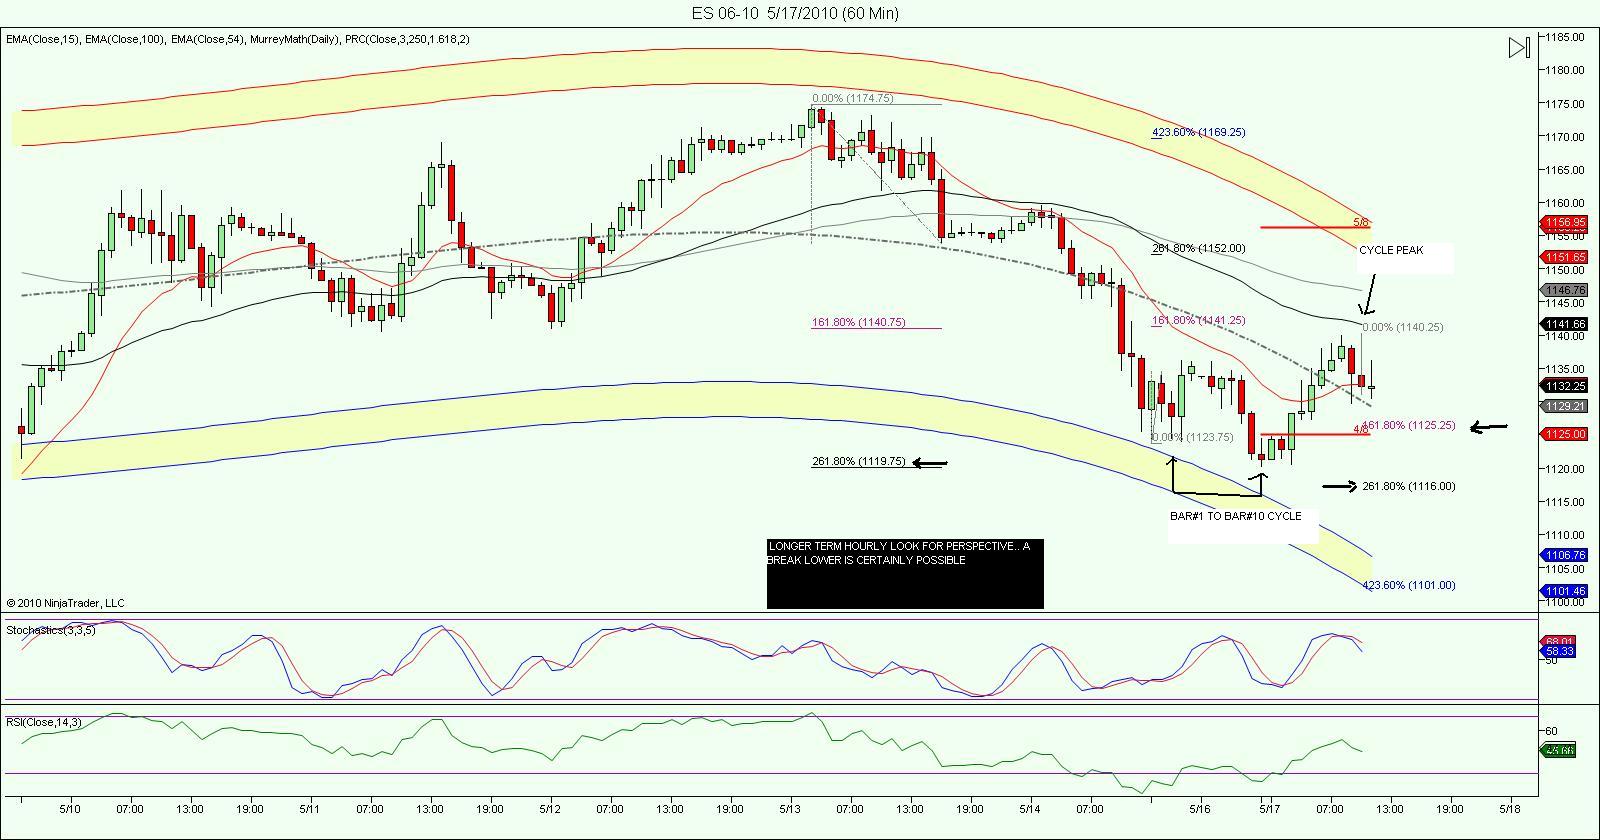
bias basically to the upside ,expecting a peak sometime today.. went long 1131.50 the red avg 5 min chart , just looking for the gap fill off the open to around 1135. COVERED AT 1134.50! that was a no brainer trade... now i can relax at work tonite... see ya in the morning!...
cm19,
curious, you're running a 50 period simple moving average on what?
5 min bars
and are you using 24 hours worth of prices or just the RTH?
RE today's market... Looks like DB could only recapture 50% of the drop from 40 to 31. raises questions about action now.
curious, you're running a 50 period simple moving average on what?
5 min bars
and are you using 24 hours worth of prices or just the RTH?
RE today's market... Looks like DB could only recapture 50% of the drop from 40 to 31. raises questions about action now.
50 day on the daily. Was wondering why you mentioned that. I now see on stockcharts.com it wasn't an outside bar, however, I did switch the parameters on my chart between rth and 24 hours a few times. On the IB chart I have it's an outside bar. Not really sure how to export an IB chart onto my computer to show you. Does anyone else have an outside bar? Sorry if I confused anyone. I just refreshed the chart and it still remains with the high at 72 and low at 53.75. Maybe when I changed the two it did something weird. IB can be a bit weird with their data sometimes. It was still a bearish enough candlestick on the 50 day sma on the daily chart to signal getting short in my opinion.
cm19, you don't have to show me, I have an IB account. I thought you were looking at intraday chart, thanks for the explanation...
Today's market, AIR apparent now back up to 1130 handle.
Not very convincing for the bulls.
Price has printed inside the low volume area of the overnight
Today's market, AIR apparent now back up to 1130 handle.
Not very convincing for the bulls.
Price has printed inside the low volume area of the overnight
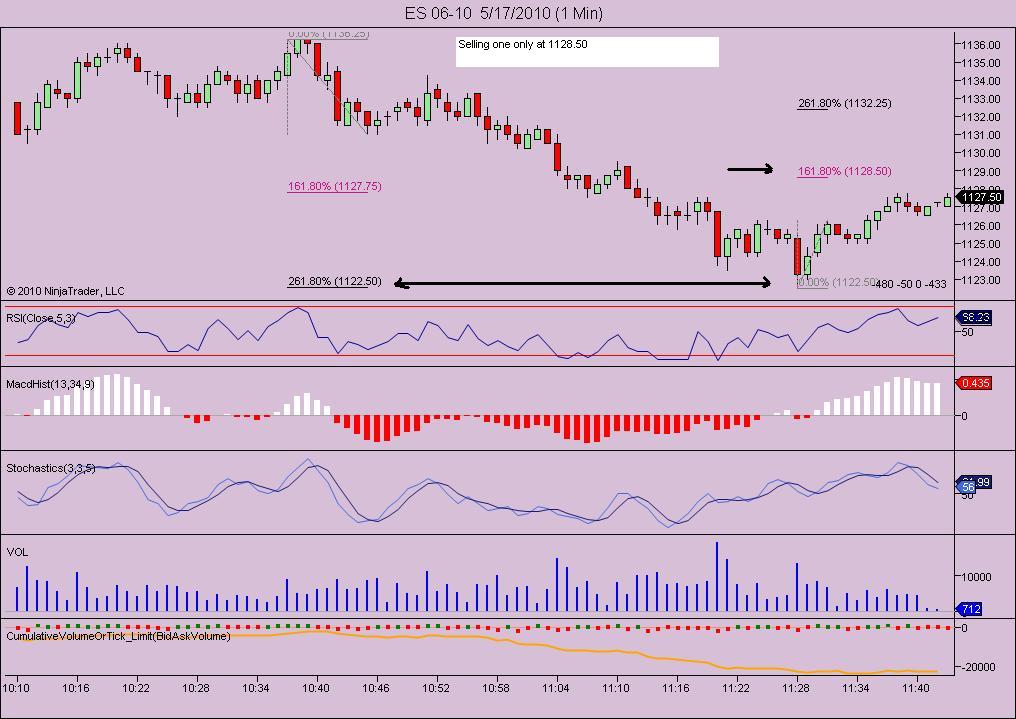
TRYINGANOTHER LONG SCALP HERE AT 1125.75
done for the day
good trading to all
good trading to all
WELL, I THOUGHT THAT ENTRY AT 1125.75 WAS TOO GOOD TO BE TRUE.. took one off on the uprush to 1127.50 at 1126.75 for plus one ,but stopped on the other at 1123.75 for a net loss of 1 handle.. still up nicely ,if i dont give it all back!
as long as you learn when you give it back. Saying that always makes me feel better
Looks very similar to the chart formation in early Feb on the daily. I wouldn't be arguing with the market right now. I agree with Kool that yesterday was a dagger in the heart of the bears. 40 is still immediate resistance then 55. See how the news is received. Looking for bearish news to be discounted the more of the same candlesticks. Low opens and high closes. A couple of those strung together and its time to get heavily long. Might miss this move, but that's the ideal set up for me.
Emini Day Trading /
Daily Notes /
Forecast /
Economic Events /
Search /
Terms and Conditions /
Disclaimer /
Books /
Online Books /
Site Map /
Contact /
Privacy Policy /
Links /
About /
Day Trading Forum /
Investment Calculators /
Pivot Point Calculator /
Market Profile Generator /
Fibonacci Calculator /
Mailing List /
Advertise Here /
Articles /
Financial Terms /
Brokers /
Software /
Holidays /
Stock Split Calendar /
Mortgage Calculator /
Donate
Copyright © 2004-2023, MyPivots. All rights reserved.
Copyright © 2004-2023, MyPivots. All rights reserved.


