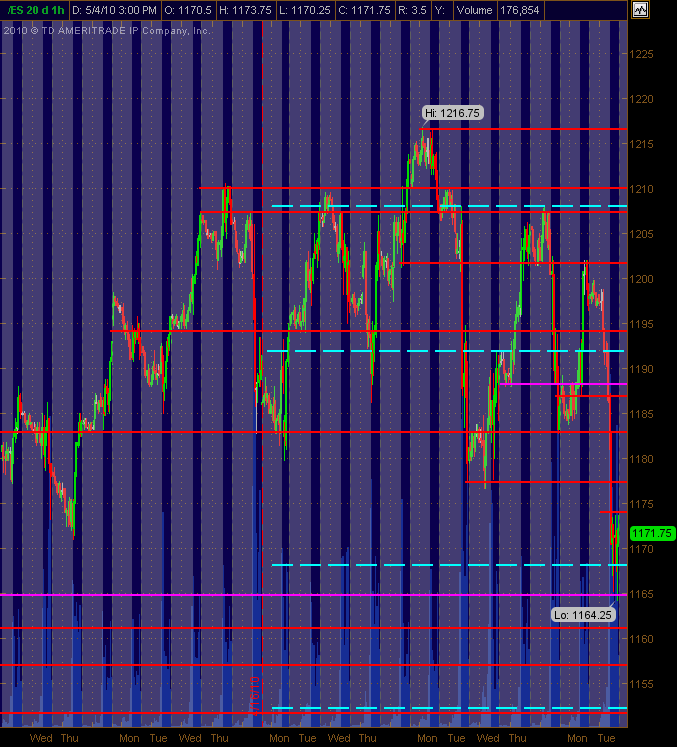
ES Short Term Trading 5/5/10
Have adjusted PASR lines that I see for potential support and/or resistance in Red with Magenta as "semi-significant" ... the Cyan dashed lines are the Weekly Pivot levels on the 30m chart that shows 24 hour trading with the gray background areas being overnight trading. Hope they're helpful as a map for Wednesday's trading.
triples still in play at 65.50..for those of you who are brave
How do you trade the triples?
I bought after they ran those stops below 1160...between 3PM and 3:30...look at all those lows on the 5 minute at that price and 59.75 was the key number I mentioned that formed dynamically this morning...
I didn't have any runners left above 63.50 as that is peak volume today.....so if this end of day rally gets them or the overnight I won't have anything on to get the triples..hope somebody here does though
I didn't have any runners left above 63.50 as that is peak volume today.....so if this end of day rally gets them or the overnight I won't have anything on to get the triples..hope somebody here does though
Looks like Bruce they want the triple
can you get us a visual on your air concept..I don't see it....perhaps we need to call it AK1 air so we don't confuse folks...
Originally posted by ak1
Air at 1163
perhaps the overnight will clean that up....that volume is in the way for the day session...LOL
Originally posted by ak1
Looks like Bruce they want the triple
Originally posted by BruceM
can you get us a visual on your air concept..I don't see it....perhaps we need to call it AK1 air so we don't confuse folks...Originally posted by ak1
Air at 1163
I like the name. Thanks. I can't give the visual as you need to watch a 30 min chart to catch it. It occures at the high and low of a recent 30 min candle. When we hit these levels we must go back 2 ticks. If we do not then we have air. I usually let this run for 4 points and then enter hoping to fill the air.
you got a bad attitude man ! Call it what you like!!
Originally posted by ak1
Originally posted by BruceM
can you get us a visual on your air concept..I don't see it....perhaps we need to call it AK1 air so we don't confuse folks...Originally posted by ak1
Air at 1163
I like the name. Thanks. I can't give the visual as you need to watch a 30 min chart to catch it. It occures at the high and low of a recent 30 min candle. When we hit these levels we must go back 2 ticks. If we do not then we have air. I usually let this run for 4 points and then enter hoping to fill the air.
Emini Day Trading /
Daily Notes /
Forecast /
Economic Events /
Search /
Terms and Conditions /
Disclaimer /
Books /
Online Books /
Site Map /
Contact /
Privacy Policy /
Links /
About /
Day Trading Forum /
Investment Calculators /
Pivot Point Calculator /
Market Profile Generator /
Fibonacci Calculator /
Mailing List /
Advertise Here /
Articles /
Financial Terms /
Brokers /
Software /
Holidays /
Stock Split Calendar /
Mortgage Calculator /
Donate
Copyright © 2004-2023, MyPivots. All rights reserved.
Copyright © 2004-2023, MyPivots. All rights reserved.
