ES Short Term Trading 5-4-10
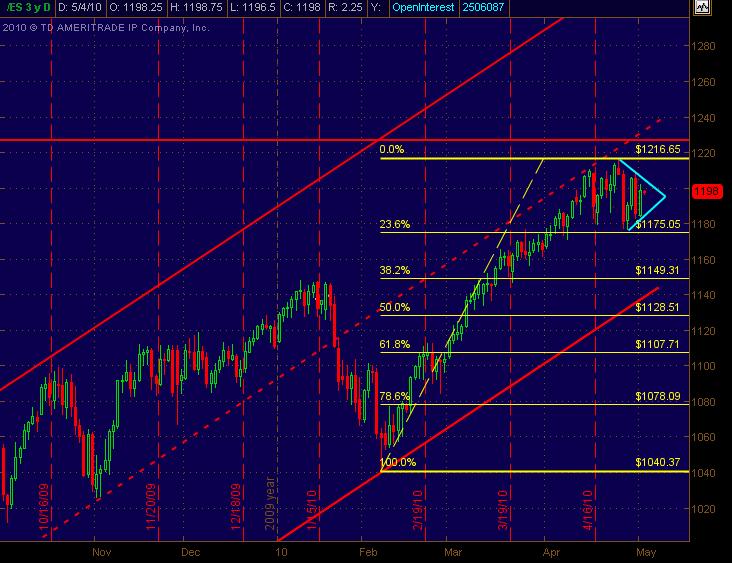
I'm still trying to get used to Thinkorswim, but here's a basic big pic overview of the Daily ES chart. Have the the trend channel and also included Fib Retracement levels though I don't typically use them much ... but nice to know where they are. And Kool and others have referenced the sideways pattern that I've thrown Cyan lines on as a pennant type formation ... even though it's not so much price swings creating it as it is the volatility increase and Wider Range trading sessions of overlapping bars. Hope this is helpful.
sure Paul...I was refering to the 90.50 lows...from abot 5:30 - 7 am EST this morning...that was just too obvious to have stops....
On mOnday we created a "P" profile as per volume which implies they will try to buy them on a lower open today into the stem of the "P"...
On mOnday we created a "P" profile as per volume which implies they will try to buy them on a lower open today into the stem of the "P"...
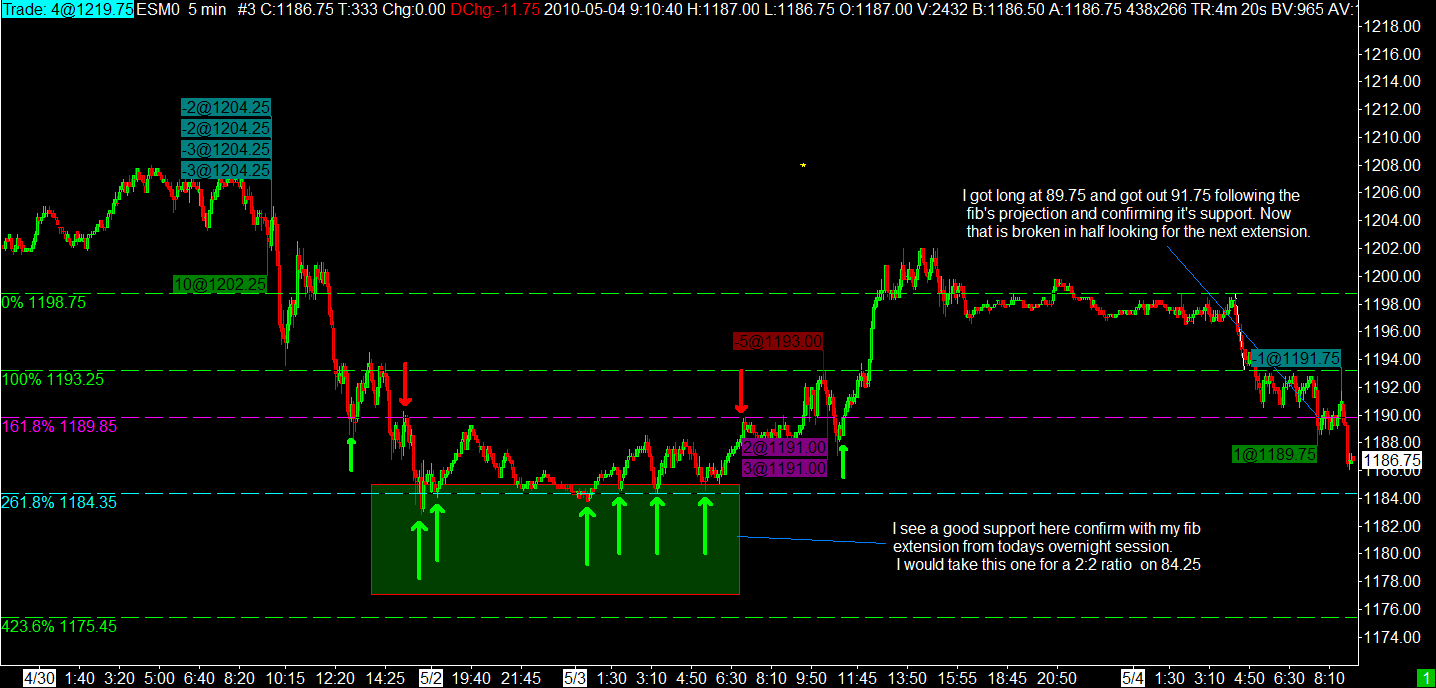
Im long at 86.50
The thing bothering me the most is, yesterday was a turning point day (apparently a high). The next turn day isnt untill Thursday.That could imply downside trend untill then. i simply had to buy that triangle boundry ,however and take my chances... long from 1187.50
I added at that 5 minute close ( 86.50)that created air ...only going in with two's until RTH....Ilike the 91-93 area as a first test....we are opening out of value so we need to be careful
Hee's something I'm gong to start paying attention to: Friday was BIG down day, but in Monday's session, the RTH Low from Friday was not tested... I am wondering if this is an ingredient in a one day wonder (yesterday, nothing more than a squeeze).
I can't waiot to see what the early RTH L is.
Friday RTH L was 82.75.
I can't waiot to see what the early RTH L is.
Friday RTH L was 82.75.
stopped on the open ..loss of 3 on each es...watching (so much for the freakin triangle!
starting RTH longs at 81.50...this gonna be trouble....
Stopped out on my level. Next level to go long is 75.75. See you there.
long at 83.50 ... this thing ain't bouncing at all yet??
Bruce I find him to be the most thoughtful, accurate and flexable analyst I have ever seen. His Sat audio updates are complete and concise. He has been calling for March 20 high to be followed by a short correction leading to an Aug 20 high which you better get out of the way. This call is over 6 mos old. New Lows, maybe and lasting for a major cycle.
Emini Day Trading /
Daily Notes /
Forecast /
Economic Events /
Search /
Terms and Conditions /
Disclaimer /
Books /
Online Books /
Site Map /
Contact /
Privacy Policy /
Links /
About /
Day Trading Forum /
Investment Calculators /
Pivot Point Calculator /
Market Profile Generator /
Fibonacci Calculator /
Mailing List /
Advertise Here /
Articles /
Financial Terms /
Brokers /
Software /
Holidays /
Stock Split Calendar /
Mortgage Calculator /
Donate
Copyright © 2004-2023, MyPivots. All rights reserved.
Copyright © 2004-2023, MyPivots. All rights reserved.

