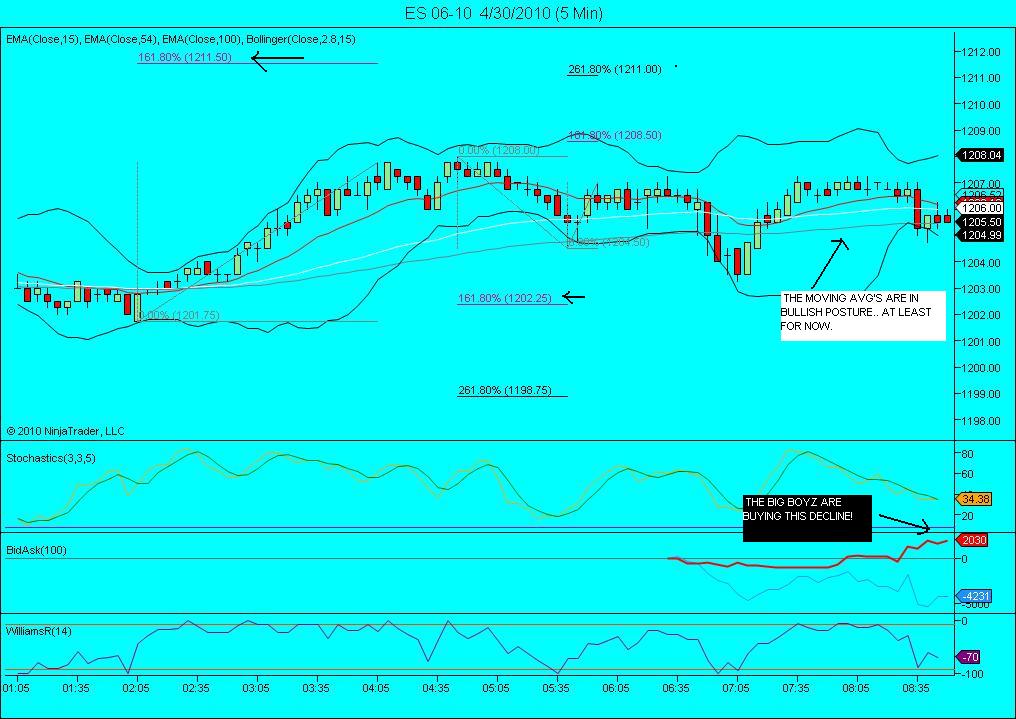
ES short term trading 4-30-10
Ok, we know that we just had a 40 point decline. Since new highs on the nyse,and other indicators, confirmed the 1216 peak, we know odds favor new highs coming. I guess you really have to decide if you think 1179.75 was enough.It certainly is possible. Its also possible that this is the second leg of a 3 wave decline down.One thing seems likely to me. An intermediate decline of some significance could be coming after new highs. Thats the scenerio i favor because of the cycles as i interpet them. Good luck trading today!
1203.50 is the LTP currently in the overnight and HTP yesterday so that is a key number and will be a target if we open gap up.
1200 was the air pocket that held and the daily PV so that is critical.
1206 - 1207.75 contains the current O/N high and YD high
1212 has key numbers including R1
93 - 94 is S1 and also the failed O/N midpoint from yesterday..
Will formulate some ideas and refine the numbers as we get closer to RTH...good odds we trade above YD RTH highs today as we had a gap and go, single prints that held and a close near the highs...so any selling fade trades should come from above there
This is just a summary of a few posts that were on that Duplicate deleted thread.
I have a small short working off the O/N HTP of 1207
Rich reminded me of the 8:30 report
I'm watching the "P" formation and the fact that we are trading at the highs of it...LIke yesterdays O/N that failed to reach the midpoint...."P" pattern is for buying IF we open in the lower end of the "P" stem....usually it implies someone is thinking short but it can be delayed...we'll see...report coming in 2 minutes
taking two off at the 1204.75 midpoint print of O/N range....trying to get 03.75 on last two or else 07.25 stops them out
Just went long one at 1205.25..chart and explaination coming..hope i dont jinx you , Bruce!.. Great call on 1207. 1207.25 is a 0.886 retracement.
could someone post yesterdays VWAP and the plus and minus 1 and two standard deviations..just from the day session.?...no chart needed justthe raw numbers will do but whatever is easier. My Investor R/T is having some real challenges lately
last two off at 03.50..and going long
flat again....doublel low gonna run out
Thanks Leo....since you seem to be a bit longer term perhaps a thread with that kind of title wouldbe appropriate. It doesn't matter to me if you post on these threads but I'm afraid those with a longer term view like yourself won't happen to see your posts in the short term threads.
Originally posted by leob
Originally posted by BruceM
could you elaborate for us Leo...I see this post was voted down so I'm assuming it is because it is a bit unclear....
"This is it" - does this mean the high is in, the low is in etc....I'm pushing for specifics on this thread and I understand those of you who don't want to explain and just make market calls...if that's the case then I suggest those folks post on AK1's No indicator Mumbo Gumbo thread...Originally posted by leob
the volume is evenly distributed all the way down. Although it didn't close below the multi day low, to me it now looks like - this is IT.
Bruce, sorry if my comments aren't clear. Firstly, my comments are mostly on daily timeframe. Looking at the daily big picture, I'm expecting a pullback of the up move since February low. For the past week, we saw what appear to be a consolidation of this up move. And the last down bar made me conclude that this maybe the last of the consolidation phase and it will be downhill from here - so the phrase "this is IT".
Next time I will post my comments on a separate topic. This way it won't mess up and confuse your topic viewers.
Emini Day Trading /
Daily Notes /
Forecast /
Economic Events /
Search /
Terms and Conditions /
Disclaimer /
Books /
Online Books /
Site Map /
Contact /
Privacy Policy /
Links /
About /
Day Trading Forum /
Investment Calculators /
Pivot Point Calculator /
Market Profile Generator /
Fibonacci Calculator /
Mailing List /
Advertise Here /
Articles /
Financial Terms /
Brokers /
Software /
Holidays /
Stock Split Calendar /
Mortgage Calculator /
Donate
Copyright © 2004-2023, MyPivots. All rights reserved.
Copyright © 2004-2023, MyPivots. All rights reserved.


