ES short term trading 4-23-10
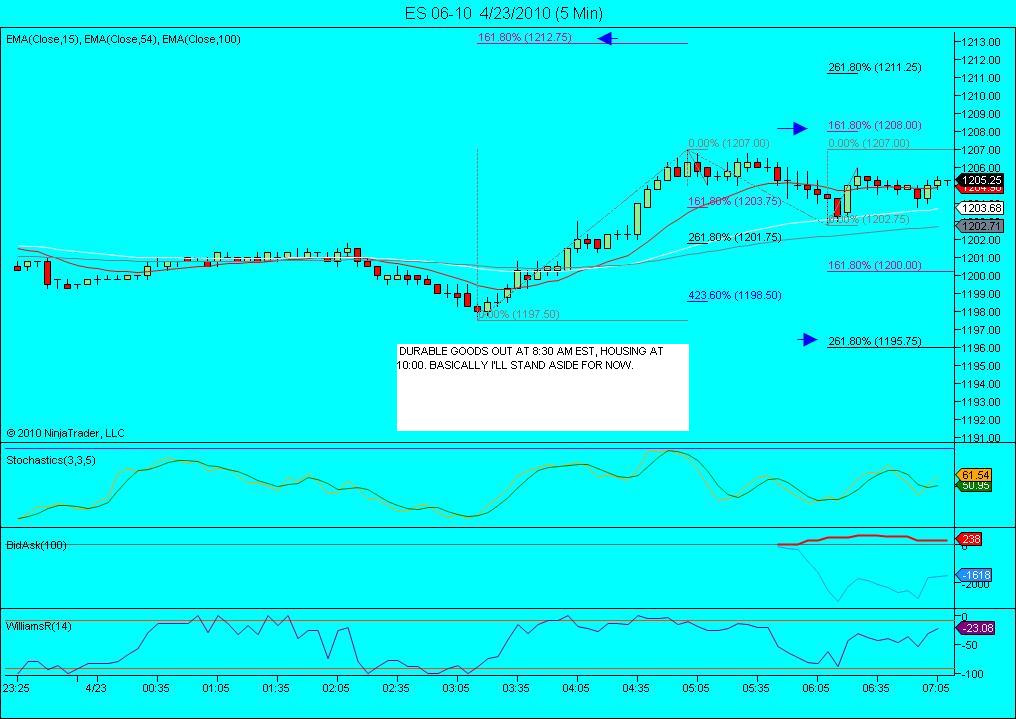
Good morning. still looking for that E wave to 1196 (or even lower3-4 handles!). Heck, i still want to see slightly higher to be sure D is complete. I also have 1212.25 as a possibility on the upside if we just continue higher. (wave 4 could also have completed at 1186.25 making a flat.). Monday the 26th looms just ahead. It certainly looks like Thurs. gave us a great low for the late Friday run up into bullish Monday. heres a short term look...
The whole zone of 1209 - 1212.50 becomes resistance as lots of different numbers up there. The overnight stole our key short idea that didn't work yesterday afternoon and came down and tested that key zone of 95 - 97.50. 97.50 is the current O/N low so that will be a great area to watch once we return there. The Dow and NQ also tested their zones so those lows are key for the markets.
1199 has the pivot and 1200.25 was another key...1200 is always a key number anyway but now more magnets are there.
At 7:30 a.m EST there is no time spent at 1203.50 so I'm trying small shorts from 1206.25. The 1203.50 is stuck between two higher volume clusters and falls above the current O/N midpoint so I think a good target. I said this same thing yesterday about the 92.50 and that still needs to be watched when we/if retrace to it.
Summary 1207 wknumber, YD high and current O/N high
1209 - 1212.50 too many numbers to write
1200-99
97.50 - 95 **** this is the big support point and best indication of any rally holding up
Good odds we trade above YD RTH high so that needs to go into our plan. I'd prefer to have my core RTH trades as sells above that to target the O/N midpoint in the day session and use the 09 - 12.50 as a possible add on point to shorts if it trades up there early and first today.
using the move from yesterday I have a measured move to 1218.25
this is my highest projection
this is my highest projection
By the way, kudos to Bruce for that 1197.00 call. Missed by 2 ticks... must be getting old too!
thanks Kool..
I just took all three off at 03.75, that was the O/N low volume zone test...hopefully not kicking myself for not holding but this is still overnight...1201.25 is a possible HV magnet for those who can hold longer than me
I just took all three off at 03.75, that was the O/N low volume zone test...hopefully not kicking myself for not holding but this is still overnight...1201.25 is a possible HV magnet for those who can hold longer than me
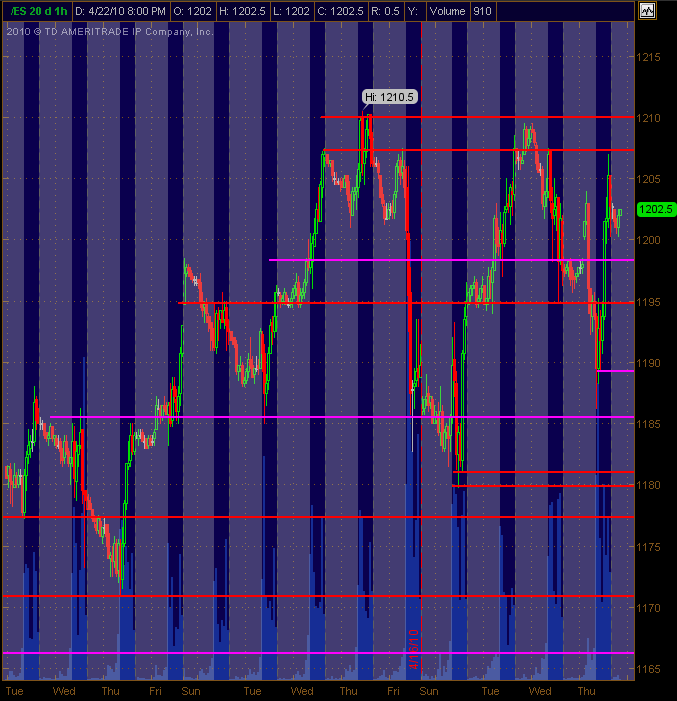
Some potential S/R levels I re-drew last night. Red are the potentially more significant ones, while the Cyan are semi-significant. Actually the first price (Cyan Line) I had below yday's RTH close held the mkts. overnight action within a couple/few ticks. Anyway, here's the ES Hourly chart.
Nice call Bruce I had ticket in to go long at97.25 overnite per your 97.50 almost got there however did get filled short at 06.75 and out at 05.25. Should be an interesting day my s/r levels are: 1214.50; 1211.75; 1209.75; 1208.50; 1206.75; 1204.25; 1201.75; 1198.25; 1197.25; 1191.00
Hey guys. I am new to these boards. i have been reading your post for about a week or so. I think it is very interesting to see how you trade. I use different stuff but it seems that in the end we come up with the same levels and targets.
In the time i have been reading it sure does make trading a little more fun as this is a very isolated business.
So now that i have said hi i will post if i have something of value to give.
In the time i have been reading it sure does make trading a little more fun as this is a very isolated business.
So now that i have said hi i will post if i have something of value to give.
welcome aboard TraderF...
I'm hoping they run it up in RTH to take out the O/N highs BEFORE they cllean up the O/N midpoint and all those stops waiting below 1203.50...that is my ideal scenario....I'm afraid that they may just push it down first without me so I'm now short two measly contracts at 04.75 ...
In analyzing myself I think this trade is out of pride.....which is a fairly stupid trade to make.....it is what it is and the target is 03.25.....
Thanks to all for the good words and numbers......lets rock the house today!!
Some tasty trades there Bruce! Again, the overnight session, as it has lately, offered some decent movement and potential trades. From the 97.50 low up to the 07.00 high ... a 10 point range is nothing to sneeze at!
The most likely scenario I see is that the market trades beyond the overnight high (same as RTH high from yday on my charts). That may offer some shorts in there in the flush up into the 09.00-10.00 area. But the Daily chart has a bullish look to it for a breakout long, and in the bigger picture it's acting like the buyers are still in control (at least to me fwiw). So, I guess I'm long biased looking for the breakout to the upside. Don't have a particular target mapped out though.
There's some good analysis here in the post this morning ... thanks to all for that!
Thanks Rich.....Most imprtant to me is that you know how to spot these without me if you find them helpful....sorry you didn't get hit on that long.....that's one of the challenges with using these zones as entries...it's probably why I use them better for targets but whatever works....good trading to you today...and nice short on your part...good start to the day.
Originally posted by richd8980
Nice call Bruce I had ticket in to go long at97.25 overnite per your 97.50 almost got there however did get filled short at 06.75 and out at 05.25. Should be an interesting day my s/r levels are: 1214.50; 1211.75; 1209.75; 1208.50; 1206.75; 1204.25; 1201.75; 1198.25; 1197.25; 1191.00
Originally posted by redsixspeed
using the move from yesterday I have a measured move to 1218.25
this is my highest projection
====================================================================
Yesterday in the above quote would be refering to Thursday.
The projection of 1218.25 is still on the radar as we have not had a pull back yet that would cancel that projection..imo
Emini Day Trading /
Daily Notes /
Forecast /
Economic Events /
Search /
Terms and Conditions /
Disclaimer /
Books /
Online Books /
Site Map /
Contact /
Privacy Policy /
Links /
About /
Day Trading Forum /
Investment Calculators /
Pivot Point Calculator /
Market Profile Generator /
Fibonacci Calculator /
Mailing List /
Advertise Here /
Articles /
Financial Terms /
Brokers /
Software /
Holidays /
Stock Split Calendar /
Mortgage Calculator /
Donate
Copyright © 2004-2023, MyPivots. All rights reserved.
Copyright © 2004-2023, MyPivots. All rights reserved.

