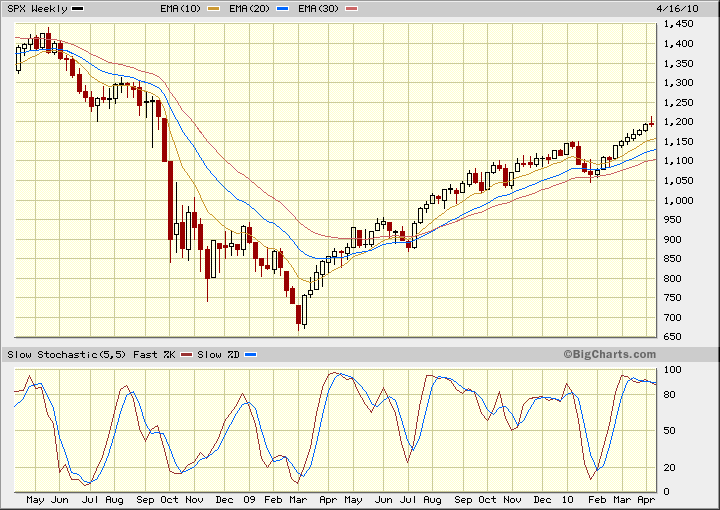
SP500 Weekly - shooting star
The shooting star candle formed after testing the July 2008 low.
IMO, if Friday closes below the this weeks low, we will see a multi-week decline, or else the market will march towards 1250 level before declining.
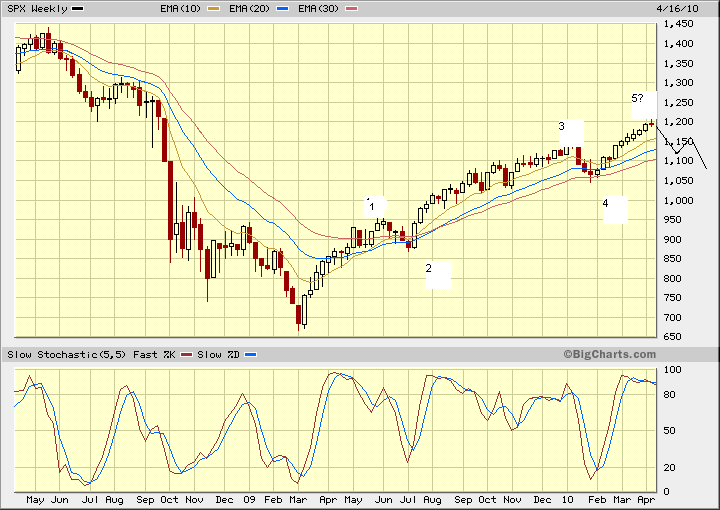
Another look at the SPX weekly chart with a 5-wave Elliott Wave and a probable A-B-C correction after the 5th wave.
Emini Day Trading /
Daily Notes /
Forecast /
Economic Events /
Search /
Terms and Conditions /
Disclaimer /
Books /
Online Books /
Site Map /
Contact /
Privacy Policy /
Links /
About /
Day Trading Forum /
Investment Calculators /
Pivot Point Calculator /
Market Profile Generator /
Fibonacci Calculator /
Mailing List /
Advertise Here /
Articles /
Financial Terms /
Brokers /
Software /
Holidays /
Stock Split Calendar /
Mortgage Calculator /
Donate
Copyright © 2004-2023, MyPivots. All rights reserved.
Copyright © 2004-2023, MyPivots. All rights reserved.

