ES Short Term Trading 4/19/10
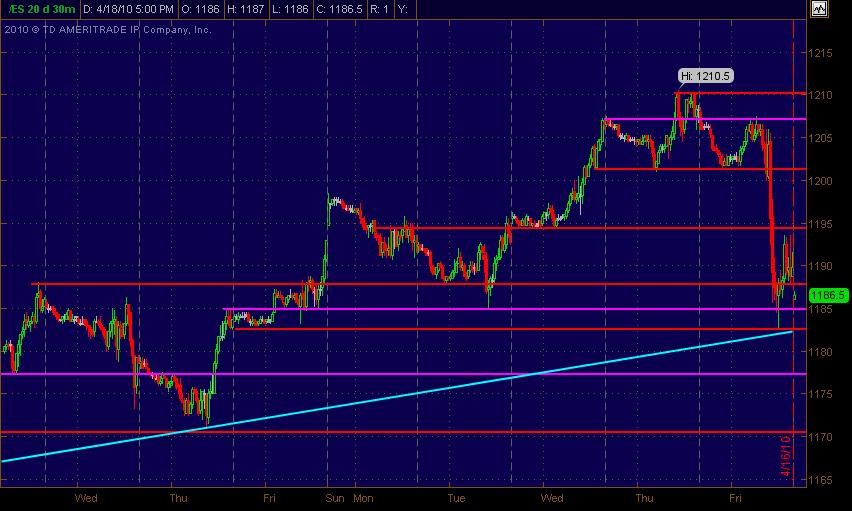
Here's my Price Action S/R levels in Red with minor ones in Magenta. It's on a 30min bar ES chart. Sunday night's mkt just opened when I snapped the screenshot. Also, there's an upward sloping trendline in Cyan fwiw.
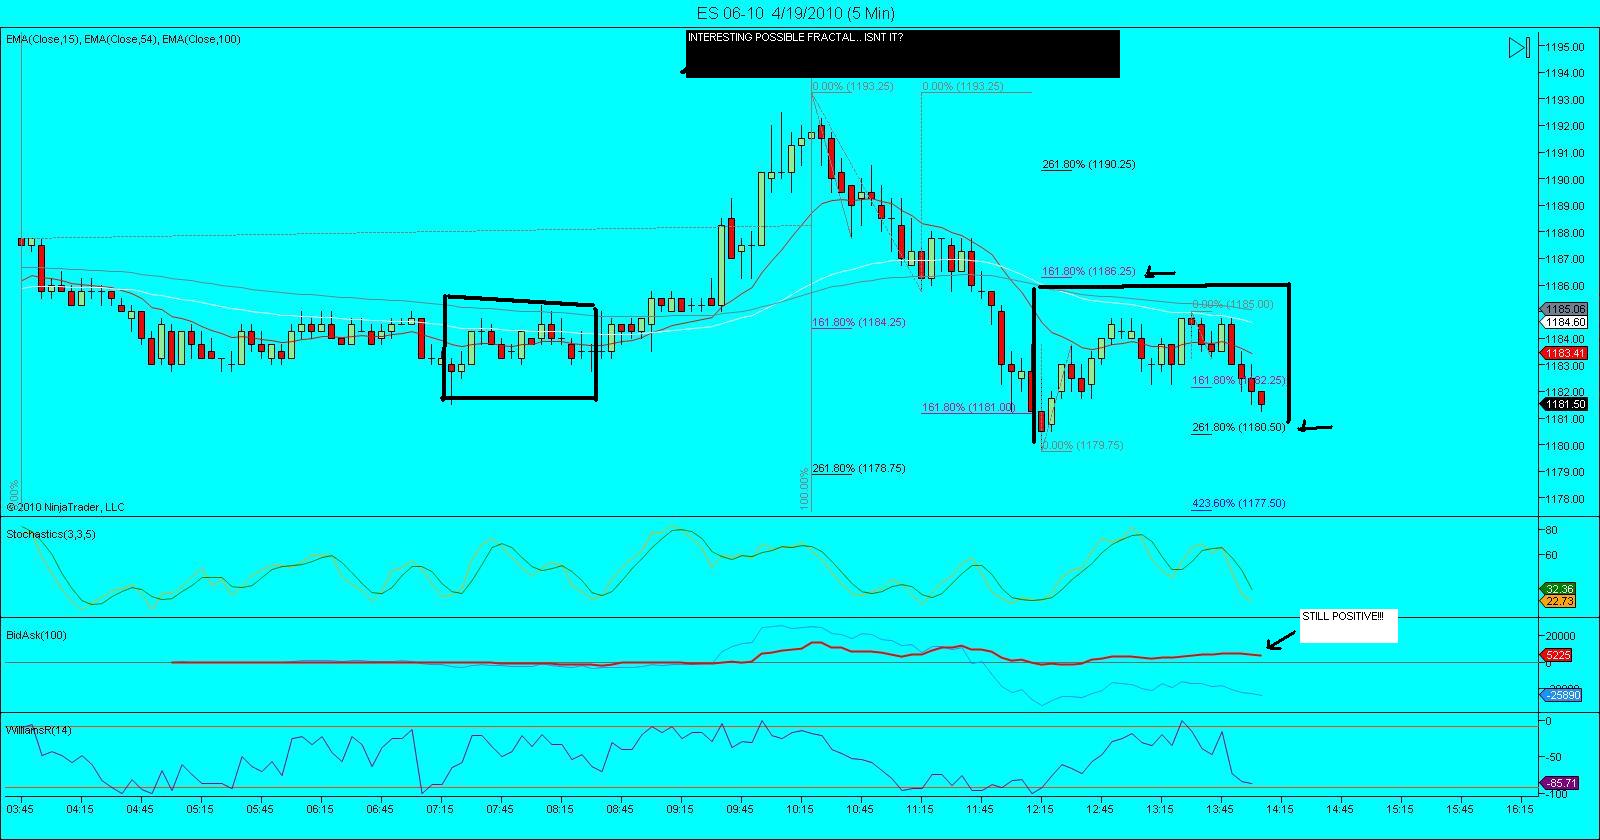
the actual short term projection here would be 1180.50 (1185.00 to 1183.25, initial move)
Kool good call on the 81 level going long nice bounce
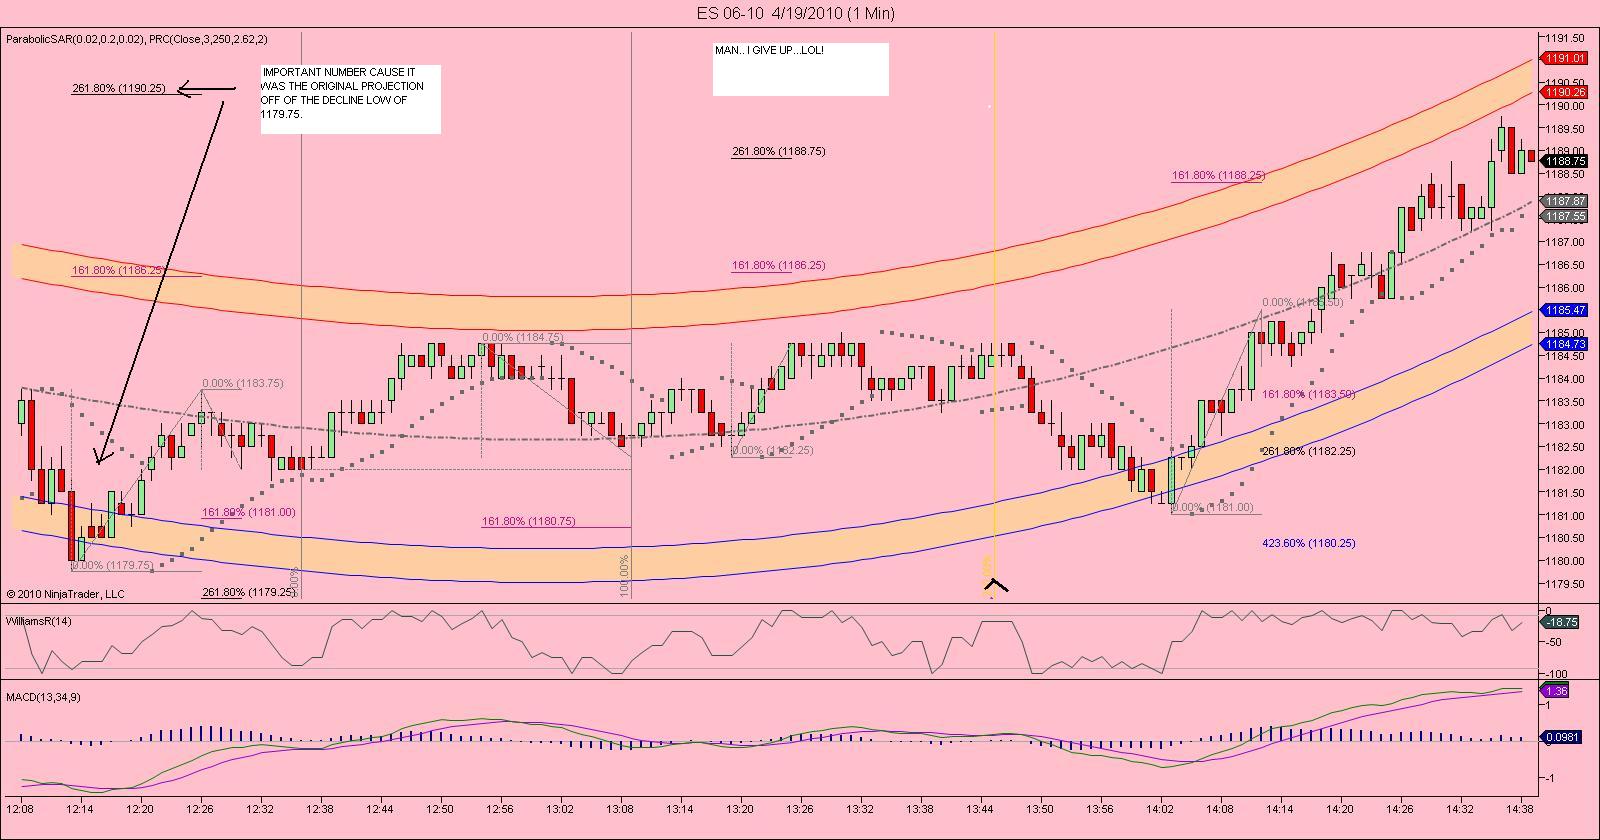
Good luck Rich!.. Clearly im the worlds lousiest trader! My order was at 1181.00 (since i hoped for 1180.50 or .75, but i was hit and never filled!!! At least the analysis was spot on.. lol
hope you took your advice and vent long
Originally posted by koolblue
Good luck Rich!.. Clearly im the worlds lousiest trader! My order was at 1181.00 (since i hoped for 1180.50 or .75, but i was hit and never filled!!! At least the analysis was spot on.. lol
Na. You are just fine tuning your entries and exits. It happens to all of us. Next one will be better.
85.50 resistance then none on my charts until 89.75
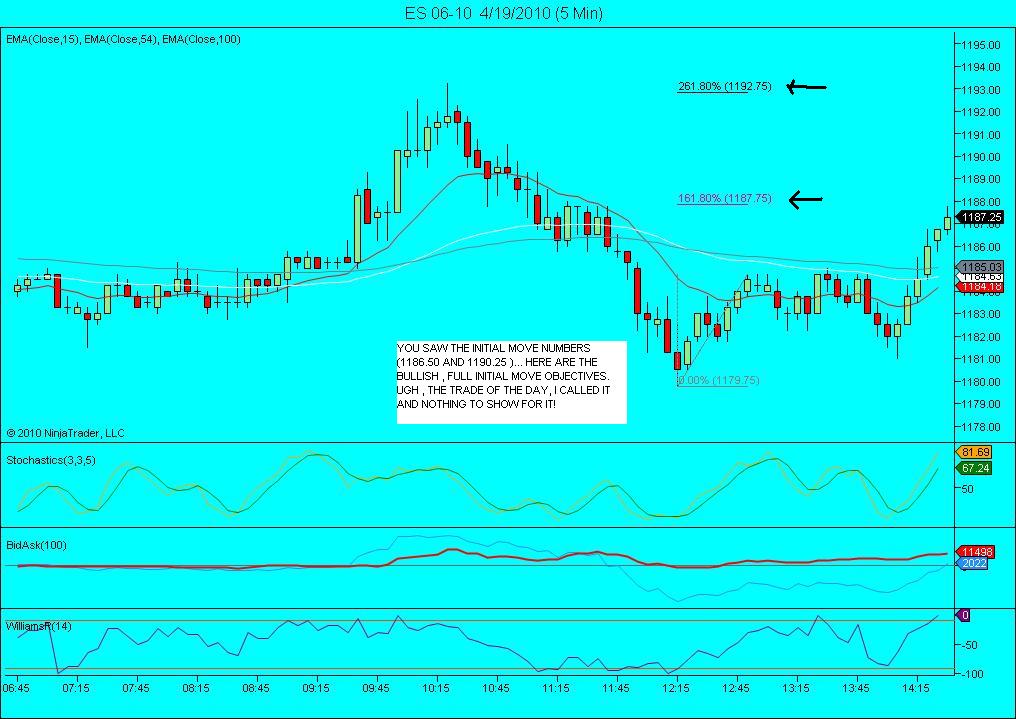
FWIW.. IF I WAS LONG ASCALP FROM 1181.00 ,ID TAKE PROFITS O/N HALF HERE AT 1186.25 AND LET THE OTHER RUN ..looking for just under 1190.25 for an exit... sigh!!!
Thanks for the link pt_emini. In case anybody wants to track this over a longer period of time I've started a topic here Mutual Fund Mondays.
Emini Day Trading /
Daily Notes /
Forecast /
Economic Events /
Search /
Terms and Conditions /
Disclaimer /
Books /
Online Books /
Site Map /
Contact /
Privacy Policy /
Links /
About /
Day Trading Forum /
Investment Calculators /
Pivot Point Calculator /
Market Profile Generator /
Fibonacci Calculator /
Mailing List /
Advertise Here /
Articles /
Financial Terms /
Brokers /
Software /
Holidays /
Stock Split Calendar /
Mortgage Calculator /
Donate
Copyright © 2004-2023, MyPivots. All rights reserved.
Copyright © 2004-2023, MyPivots. All rights reserved.


