ES short term trading 4/15 /10
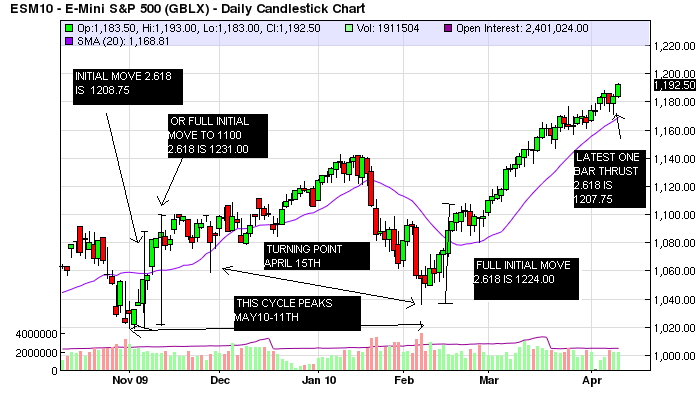
Wow, some action, huh? The power in the rally off of the Feb. low is stunning (3rd waves usually are!). New highs exploded today to 611, a new rally high. This basically means that even if we tank tonite or tomorrow, higher prices eventually are likely. Im going to reprint the chart i last showed on last weekends preview because i think it may be important, and ill try to do a brief update tomorrow morning if i can stay awake!.....
Here's my homework:
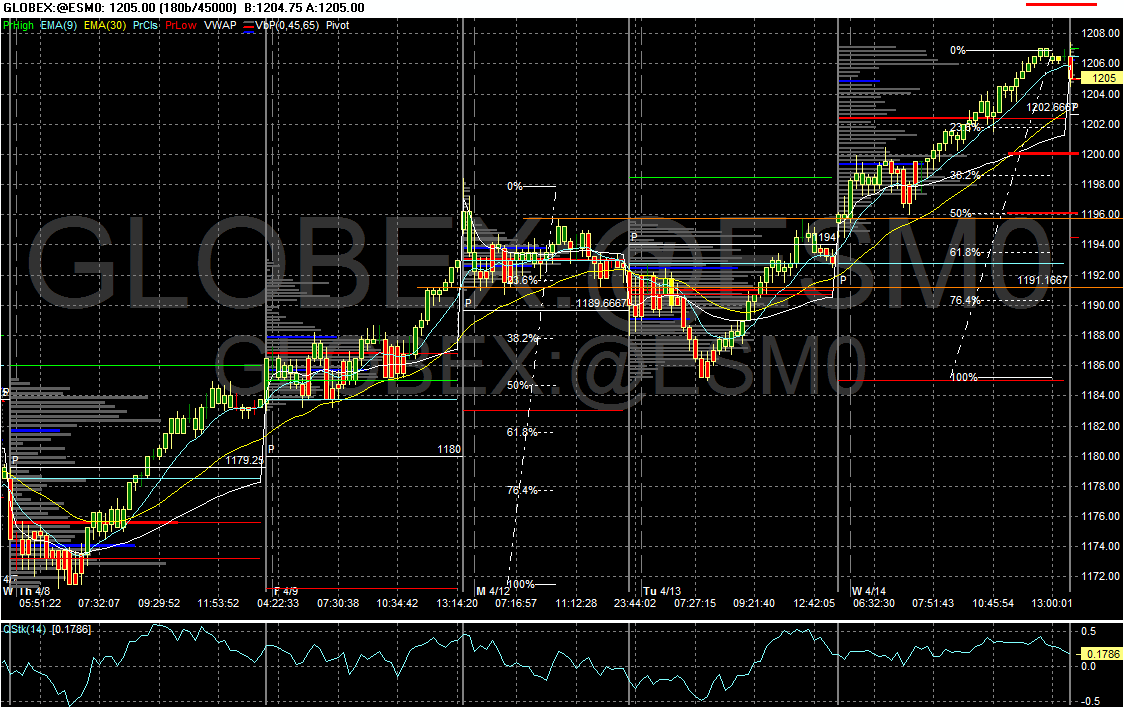
key levels I will be watching for a trade:
1210: 123.6% extension of move up from 1185 (R1=1211)
1206: confluence of HVN + gap fill + HoD (VAH = 1204.75)
1200: morning resistance + HVN (VAL=1198.75)
1196: LVN + 50% RT + prior RTH LoD and HoD
1193: 61.8%RT + gap fill + fair value for both Mon+Tues composite volume profile.
Also, we had a yet another trend day today, so I will be looking for MATD oscillations much like Apr9 morning session. Least likely scenario is another trend up day.
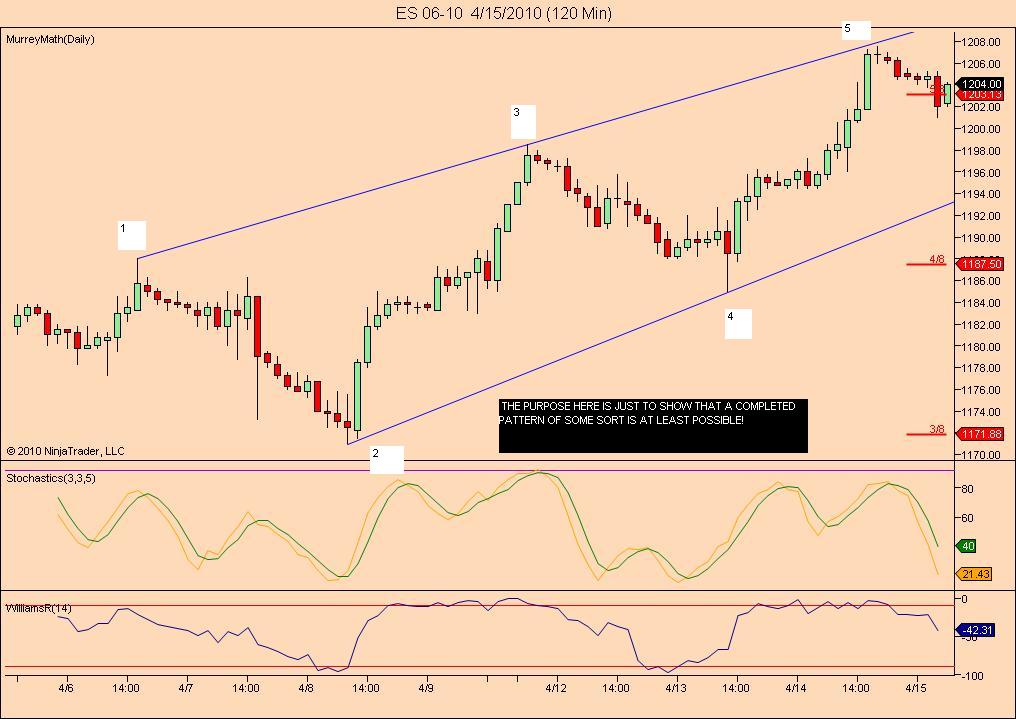
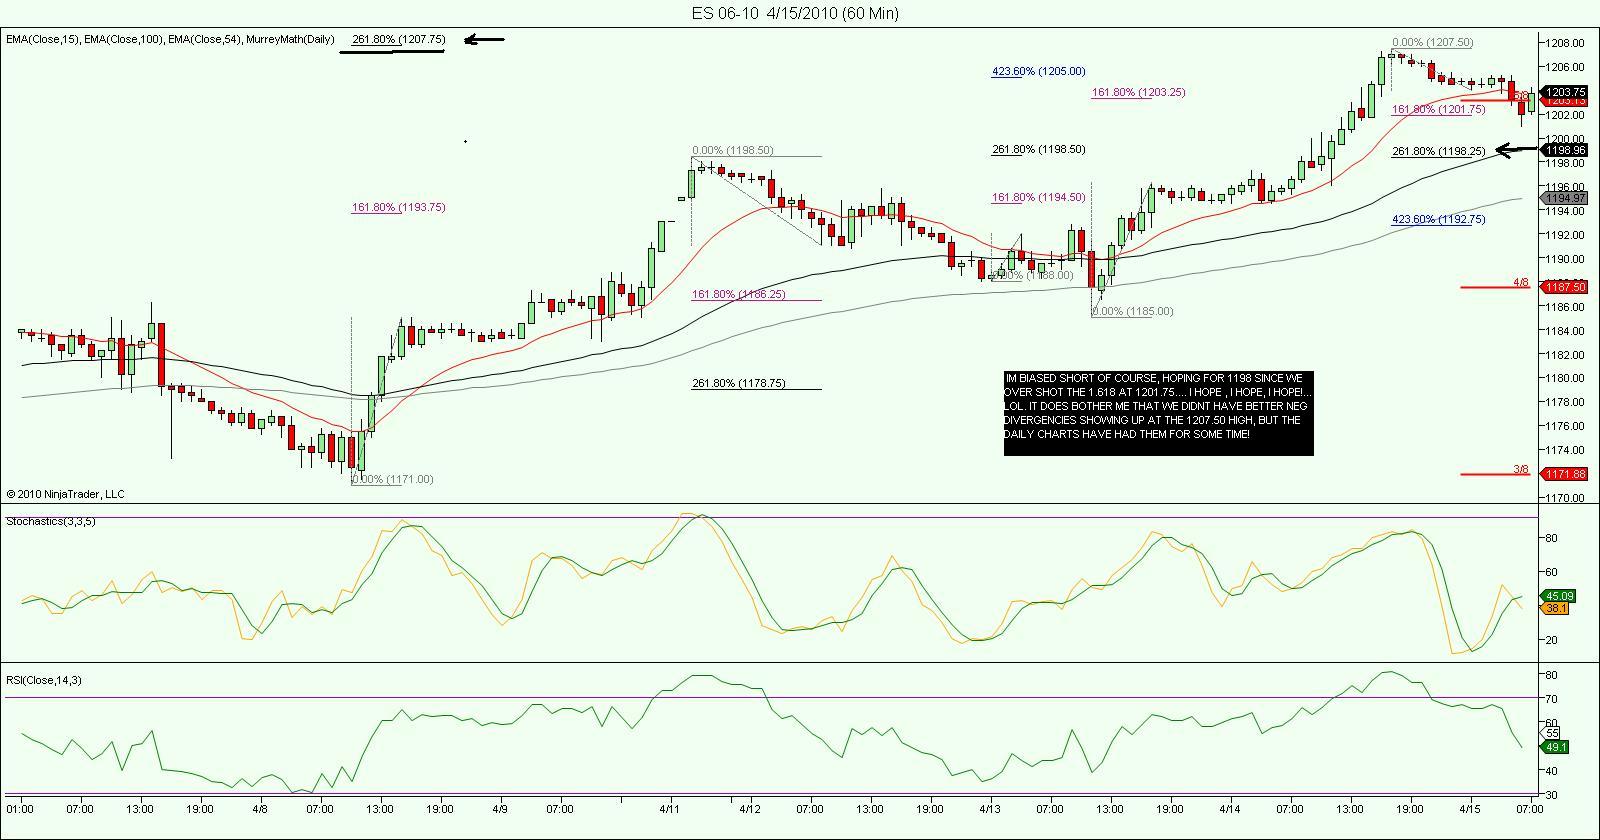
Ever since the beginning of March, the daily projections told us to expect 1207.75 , and surpassing that , 1224.00. At the time , im sure no one paid it much mind , but here we are! i tried to show the most likely time frame might be April 15th. Todays high , so far is 1207.50. Now im hoping for a typical 17-25 handle correction and then eventually a resumption of the rally to 1224-1234 by mid May. Its possible that we just continue on, but im hoping for a small distribution phase to begin. We'll know more by the weekend. If so , it'll go down as one of my better calls, but its way too early to pat myself on the back yet! In a bull rally like this one , the surprises are always on the upside. Anyway who really cares right? We are short term traders so all we really want to know is what happens on the very short term. Currently im short from 1206.50 and hoping for a move to the 1198 and change area. Heres a quick look at the short term...starting with the 2 hour chart...
Going to get some sleep, see ya later this morning!
buyers defending VAH initially:
range is 1204.75 - 1206 for opening 25min. (that brief tag of 1206.25 ignored for now); smallest i've seen in a while.
no TICK extremes so far, can participants be this unemotional? Hopefully the 10am news event will shake things up
range is 1204.75 - 1206 for opening 25min. (that brief tag of 1206.25 ignored for now); smallest i've seen in a while.
no TICK extremes so far, can participants be this unemotional? Hopefully the 10am news event will shake things up
Great work Koolblue. I just got long at 1207.50 with stop at 1206.25. My objective is 1213.00. Will see if it give me that today.
Good luck guys!
Ooops I see I need to move my protecting stop up to B.E.
Good luck guys!
Ooops I see I need to move my protecting stop up to B.E.
Originally posted by phileo
Least likely scenario is another trend up day.
The irrational exhuberance knows no bounds - if sellers don't show up 1210, well, I may have to eat my words.
Wave 3 continues.. for now! Aparently that 1201 and change was the oblective. I still want to look for a short term peak today,(the 15th!) so i'll likely be selling for scalps mostly
I believe that this one is not going futher the pivot resistance of 1211.00
Originally posted by i1hunter
I think that it has one more leg up. In the 2 min. chart I can count 3w and right now working on the 4? a.b.c.d.e? if so then the 5w should be up to the 1114. will see.
The 2m. chart did the a,b,c,d,e and the 5w but it was very, very small 5w. I thought the 5w will subdivide.
One thing that bothered me was that the 2m. stochastic was not even in a low cycle (oversold) at the end of "e" and the 10m. stochastic was still on a high cycle or in the overbought area. If I was expecting a meaningful move, then the two stochastics should have been in the oversold area.
I hope this is some what clear.
Great work from everyone here. Thanks for sharing your way of seeing.
Emini Day Trading /
Daily Notes /
Forecast /
Economic Events /
Search /
Terms and Conditions /
Disclaimer /
Books /
Online Books /
Site Map /
Contact /
Privacy Policy /
Links /
About /
Day Trading Forum /
Investment Calculators /
Pivot Point Calculator /
Market Profile Generator /
Fibonacci Calculator /
Mailing List /
Advertise Here /
Articles /
Financial Terms /
Brokers /
Software /
Holidays /
Stock Split Calendar /
Mortgage Calculator /
Donate
Copyright © 2004-2023, MyPivots. All rights reserved.
Copyright © 2004-2023, MyPivots. All rights reserved.


