ES S/R Map for 4-5-10
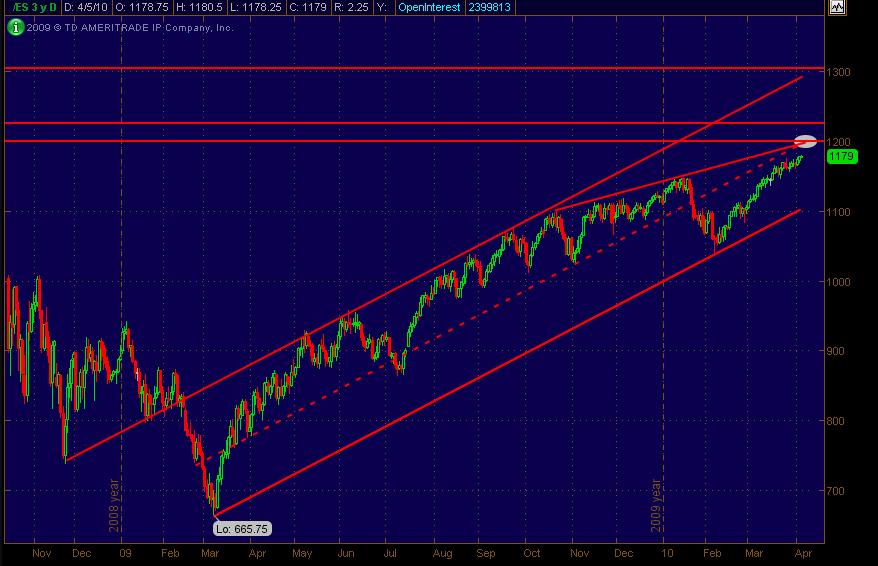
First an ES daily with some longer term Price Action Resistance red lines above mkt ... and also a trend channel sloping upward with a dashed midline. Includes an additional "trendish" type line across the top of recent price swings that intersects the 1200 area ... the white oval demarking where the channel midline also intersects.
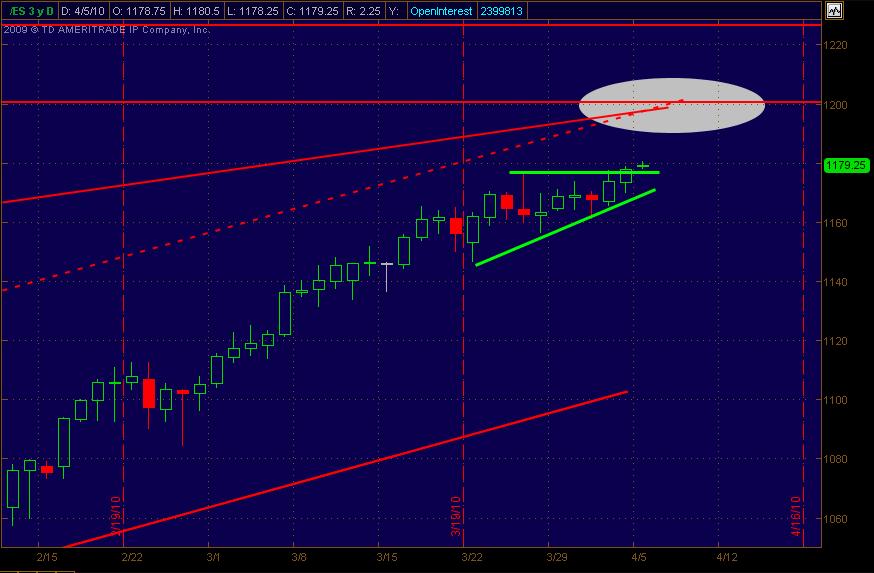
Drilling down further on the ES Daily ... there's a small triangularish (new word) price action formation that's somewhat bullish - green lines. What's interesting is how most of the days have been closing above their opens for a while now. A very grinding long move. But that's the apparent trend it seems to me, at least for now.
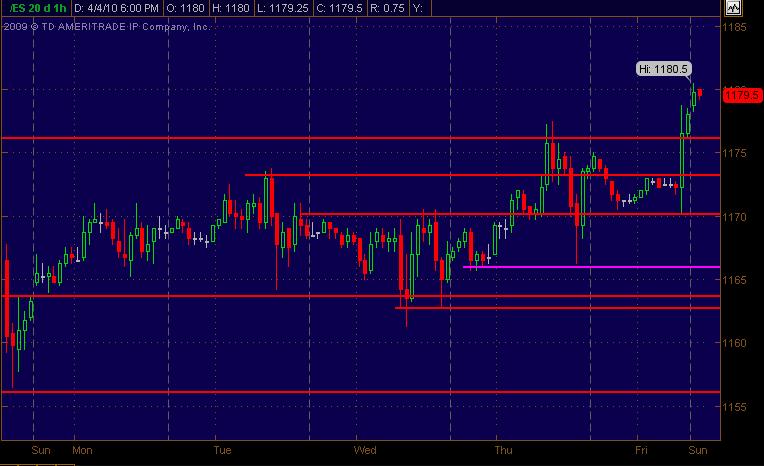
Here's an hourly chart with more Price Action S/R lines. Hope this is helpful ... is what I'm looking at and trading off of. Magenta line(s) are less significant S/R levels ... just what I'm seeing.
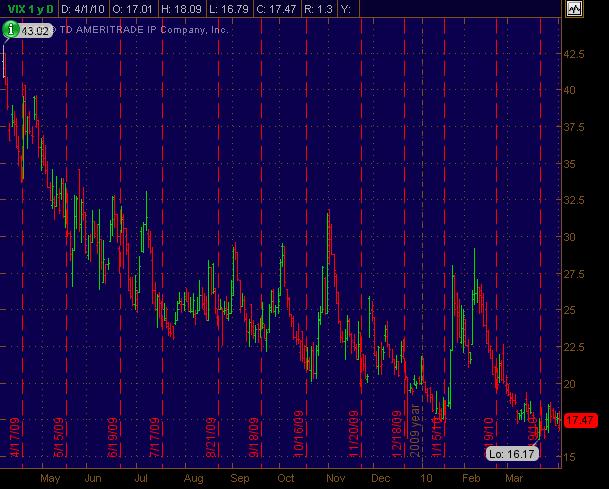
And fianlly ... a VIX, Volatility chart. Man oh man how volatility has shrunk down quite a bit. This may be helpful for trading ideas based upon smaller daily ranges on average and overlapping daily bars of lots of back and forth movement while grinding higher. I'm not gonna try to guess when it'll kick back up ... but will look at and trade based on what it's showing now. Just another thing to see visually and keep in mind for now I guess.
Emini Day Trading /
Daily Notes /
Forecast /
Economic Events /
Search /
Terms and Conditions /
Disclaimer /
Books /
Online Books /
Site Map /
Contact /
Privacy Policy /
Links /
About /
Day Trading Forum /
Investment Calculators /
Pivot Point Calculator /
Market Profile Generator /
Fibonacci Calculator /
Mailing List /
Advertise Here /
Articles /
Financial Terms /
Brokers /
Software /
Holidays /
Stock Split Calendar /
Mortgage Calculator /
Donate
Copyright © 2004-2023, MyPivots. All rights reserved.
Copyright © 2004-2023, MyPivots. All rights reserved.


