Correction to Volume Profile Definition
I'd like to request that the definition for Volume Profile be updated. It states that "volume profile is just like Market Profile except that..." and then it explains the differences as if they were minor.
The Market Profile display looks like the Volume Profile display, but in practice, they are displaying two entirely different things. Thus, the assertion that they are "just like" each other is misleading.
Market Profile is a time-based indicator whereas Volume Profile is agnostic about time.
The philosophy behind Market Profile is that the more Time Periods at Price=N in which an issue trades, the more significant is that price. Volume Profile does not care WHEN an issue trades at Price=N, it cares only HOW MUCH of an issue trades at a particular price.
This is a meaningful difference.
In theory, an issue could trade one contract at Price=N in each of 48 1/2 hour time periods during a trading day. The same issue could trade 50,000 contracts at Price=X in only a single 1/2 hour time period. In Market Profile, Price=N would appear as a "peak" and Price=X would appear as a valley. In Volume Profile, X would be the "peak" and N would be the "valley".
Originally posted by jeheald
...the assertion that they are "just like" each other is misleading...
I completely agree with you and I've made the update using some of your text verbatim which almost perfectly describes Volume Profile. Thanks for the input.
With all due respect, its just more confusion in an already confused state of mind.
Originally posted by ak1
With all due respect, its just more confusion in an already confused state of mind.
How could we clarify it to reduce the confusion?
What is the time frame you are using here? What is the platform you are using?
Originally posted by sbaopao
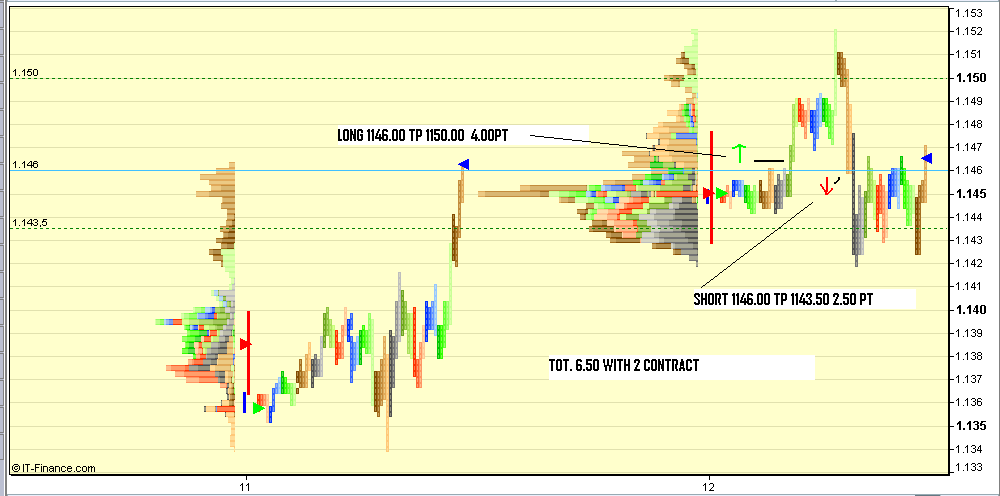
this my trading with volume profile.
Emini Day Trading /
Daily Notes /
Forecast /
Economic Events /
Search /
Terms and Conditions /
Disclaimer /
Books /
Online Books /
Site Map /
Contact /
Privacy Policy /
Links /
About /
Day Trading Forum /
Investment Calculators /
Pivot Point Calculator /
Market Profile Generator /
Fibonacci Calculator /
Mailing List /
Advertise Here /
Articles /
Financial Terms /
Brokers /
Software /
Holidays /
Stock Split Calendar /
Mortgage Calculator /
Donate
Copyright © 2004-2023, MyPivots. All rights reserved.
Copyright © 2004-2023, MyPivots. All rights reserved.
