Price bar overlap
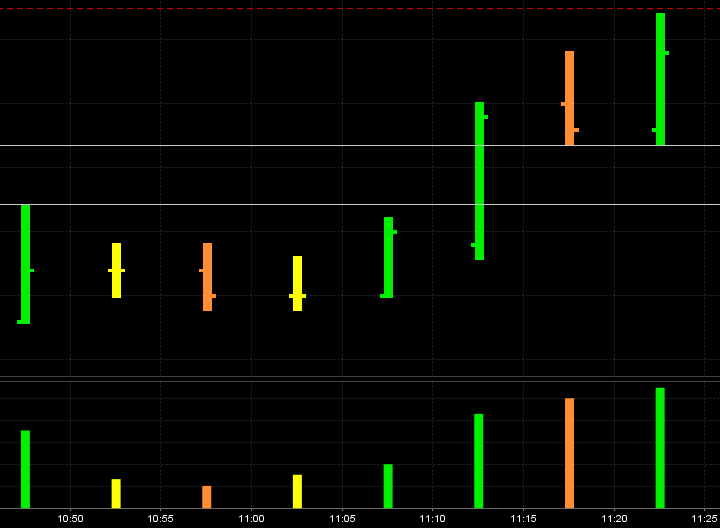
I'm planning to explain this more soon but this is a start. Notice how we have what I call an "air pocket" in between the high of the first green bar from the left and the low of the last green bar on the right.
These are 5 minute bars and I will include the context chart
This thread will attempt to expand on the concept of "mini singles" that we have covered before from the one minute chart. I have snapped a horizontal line to represent this "Pocket"
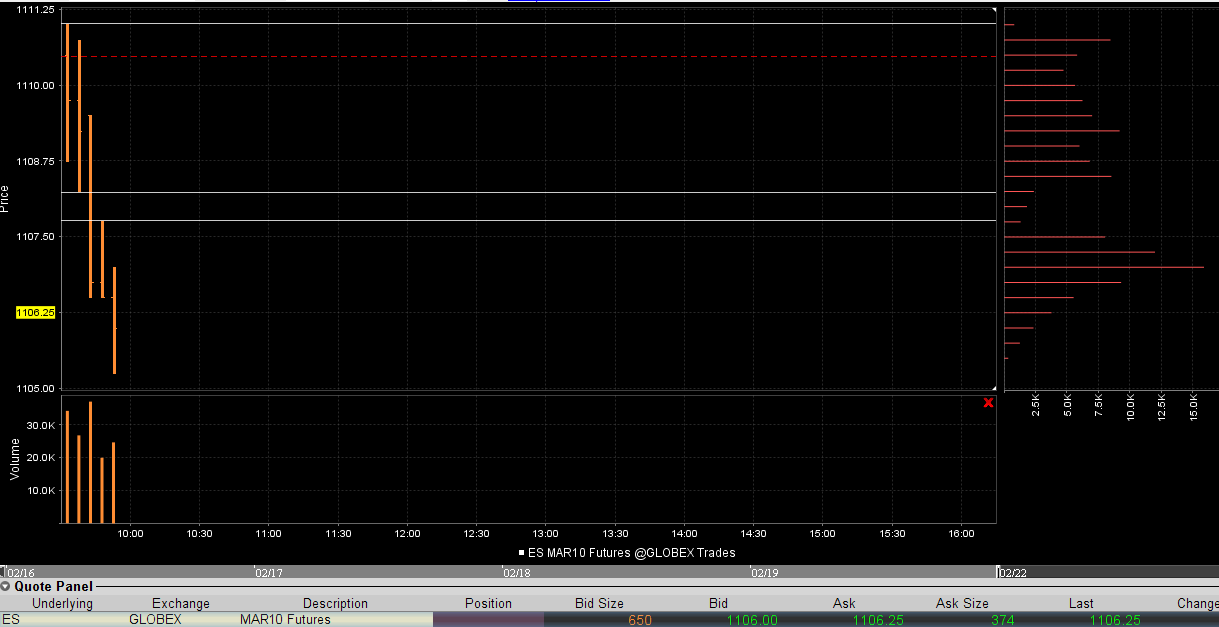
These are 5 minute bars and I will include the context chart
This thread will attempt to expand on the concept of "mini singles" that we have covered before from the one minute chart. I have snapped a horizontal line to represent this "Pocket"
Here's a trade I just finished....when the 3rd bar trades and closes below the first two we have "air" between the close of the third bar and the low of the second bar. When the 4th bar forms it makes an attempt to fill in the air and fails but it raises the overlap area.
The price histogram does a great job at showing us where the "air" is if we need it. Look at the low area on the right side of the screen at the price histogram. That denotes the air.In a very short while you won't need to snap lines or use the price histogram as you will spot these areas very easy.
I was hoping to get a good shot of the histogram so this will do it. I don't usually snap the lines so they are there for demonstration.
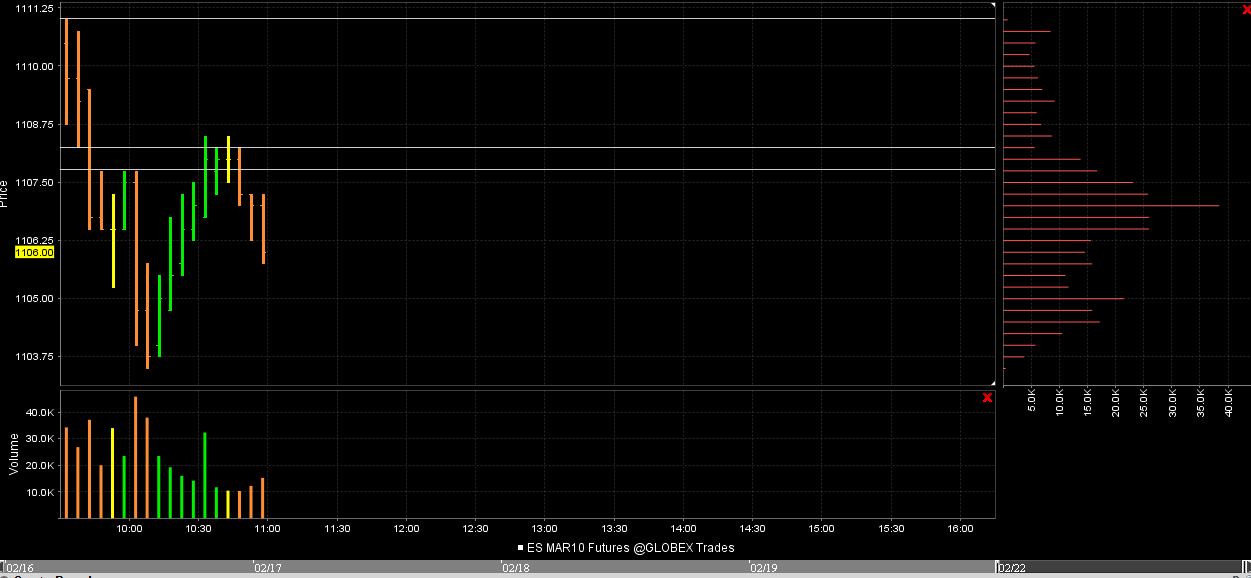
To the chart:
This gets really cool now. The 6th bar tries to rally but fails to fill in the air pocket. The 7th bar makes a new low and CLOSES below all other bars so we have new air. I didn't snap that one on the chart. Then two bars later we get an inside bar.
Then the rally back up to fill in the original air pocket. I don't won't anyone to think that these only work on the short side! Notice the change in the price histogram too!
Then the rally back up to fill in the original air pocket. I don't won't anyone to think that these only work on the short side! Notice the change in the price histogram too!
With the knowledge of the air pockets and your own evaluation you may decide that buying and selling breakouts/breakdowns is not the way to trade. I remember reading a long time ago that Borsellino would never trade on breakouts. He would evaluate the retracement back or near to the break area.
Some other possible ideas would be to use ranges as a filter. Today we opened inside the range of Friday so we are in a natural POSSIBLE congestion area. This can increase the odds of consolidating. If we had opened outside of the range then we need to be careful as it could have led to a trend and the air pockets will not get filled in.
Some other possible ideas would be to use ranges as a filter. Today we opened inside the range of Friday so we are in a natural POSSIBLE congestion area. This can increase the odds of consolidating. If we had opened outside of the range then we need to be careful as it could have led to a trend and the air pockets will not get filled in.
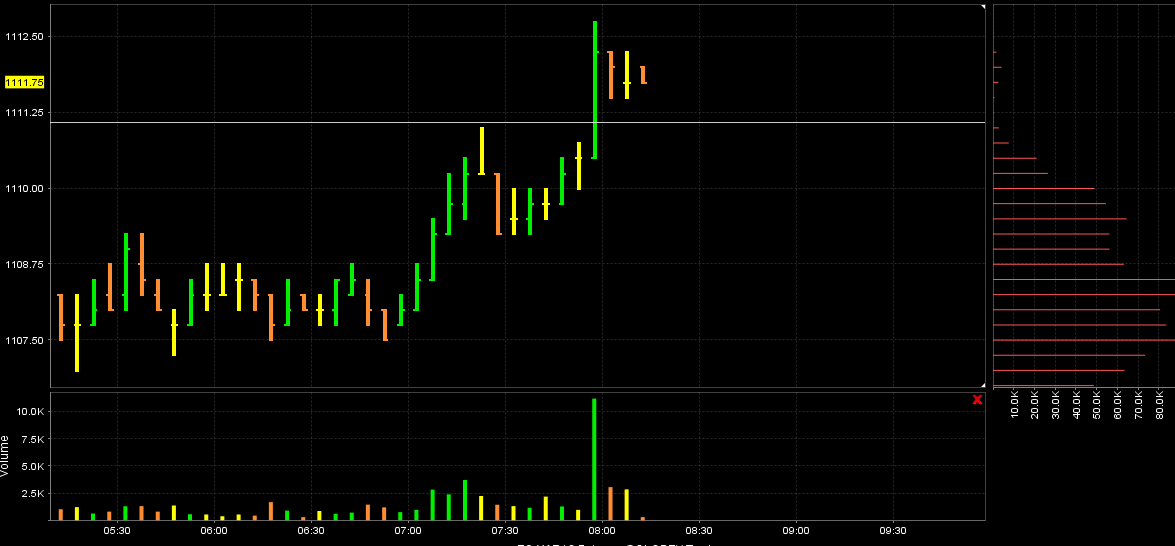
Here is a trade I almost took but had to get my kid off to school and missed it. This heavy volume bar takes out the current overnight high and the previous RTH high ( Fridays high ). Then we get the key CLOSE outside that range to create the air pocket. The horizontal line is actually the RTH high of friday on my chart. Once again we get the inside bars after that. So far that bar has put in the highest bar of the overnight session and the current day session.
Very cool Bruce...Thanks for sharing...this will add to the arsenal!!
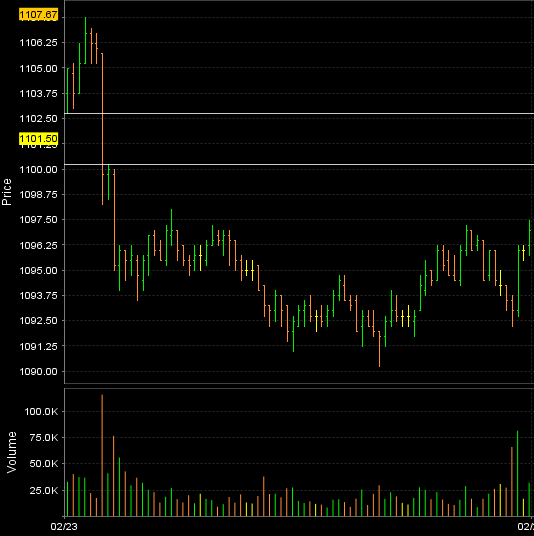
I'm glad some are finding this work interesting. Here is a screenshot of Tuesday. There was only one air pocket that didn't get filled in on Tuesday. I have the lines snapped at 1100.25 - 1102.75 to denote this pocket. Here is the chart for reference.
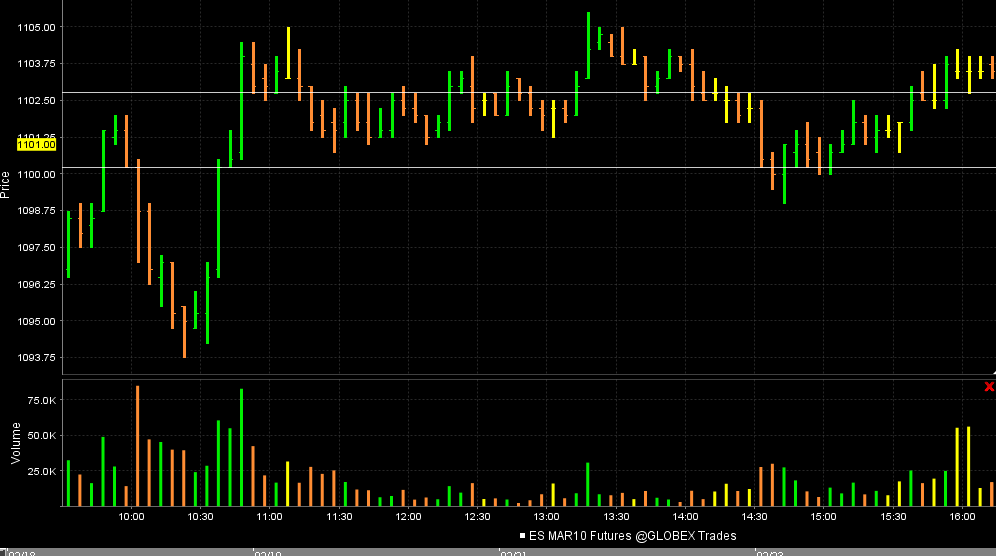
Now look what happens today when we open on Wednesday. We rally right up to that air pocket and create a new air pocket with todays trade. At first we fail to fill in the entire pocket from Tuesday but later come back up to fill it in.
If we look at this chart on it's own we can find three incidences where we create air pockets. All get filled in. Lots of great opportunites today.
If we can hold on to this pocket as support we will go on to make highs over 1112 in the overnight or on Thursday. Lets think about it for a second, we create the original pocket on Tuesday with great volume on the way down but then we are able to trade over that on the upside on Wednesday and erase that volume thrust/air pocket
there;s an air pocket above 93.75 so starting longs at 92...I will add if we get a new 5 minute close below the current overnight low....chart will follow
have 89.50's working now...this is a better long I think as they finally took out that 88.50 I've been waiting for.....that was 5 ( 5 minute) bars in a row from last week..no more adds till RTH opens
seems to be a couple of pockets of air now..
Originally posted by PAUL9
BruceM,
Are you a head honcho?
Have to guess You are a head honcho.
I Need to find instructions for starting a thread.
I sifted through FAQ and found nothing. can you direct?
I sent you a PM with more info but basically it says click the "New Topic" link at the top of this page to create a new "thread". It's a bit confusing as threads are called topics on this forum.
Emini Day Trading /
Daily Notes /
Forecast /
Economic Events /
Search /
Terms and Conditions /
Disclaimer /
Books /
Online Books /
Site Map /
Contact /
Privacy Policy /
Links /
About /
Day Trading Forum /
Investment Calculators /
Pivot Point Calculator /
Market Profile Generator /
Fibonacci Calculator /
Mailing List /
Advertise Here /
Articles /
Financial Terms /
Brokers /
Software /
Holidays /
Stock Split Calendar /
Mortgage Calculator /
Donate
Copyright © 2004-2023, MyPivots. All rights reserved.
Copyright © 2004-2023, MyPivots. All rights reserved.
