SP 666 Episode 2?
Re: SP Monthly chart
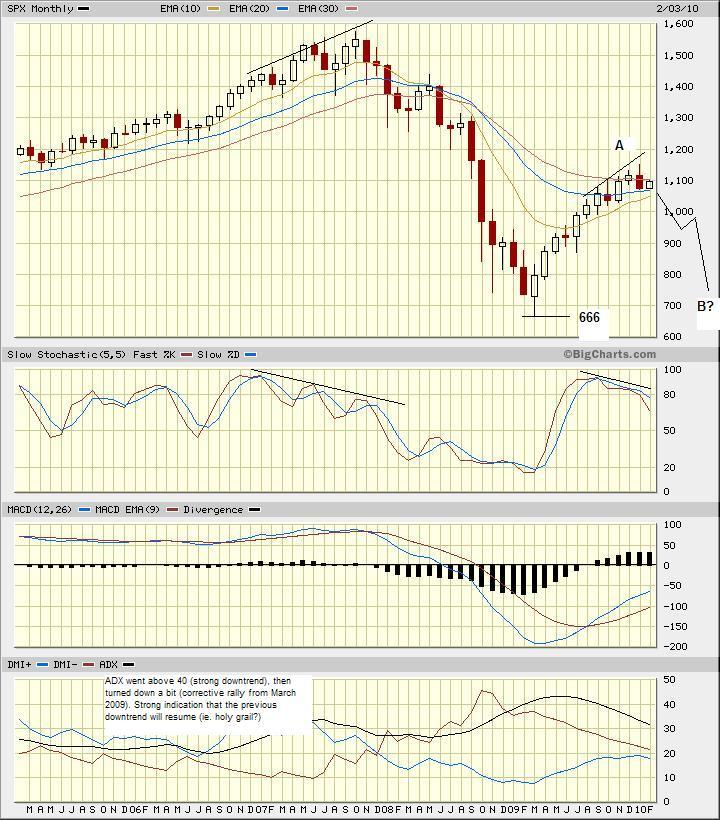
Looks like we are in the early stage of the B leg of the ABC correction. It is possible, judging by way things are going, the 666 level will be tested.
Your thoughts?
666 is too far down, but this bubble is due to release some air as it is all govt. stimulus.The only thing keeping it going for the next 2 months could be the forced tax deferral investment like RRSPs.
The US economy, which is now very fragile, is not immune to external forces. It used to be marching in its own drum beat. The bulk of the
-260pts DOW plunge yesterday, I think, was due to European economic news. China also have its own stimulus bubble.
-260pts DOW plunge yesterday, I think, was due to European economic news. China also have its own stimulus bubble.
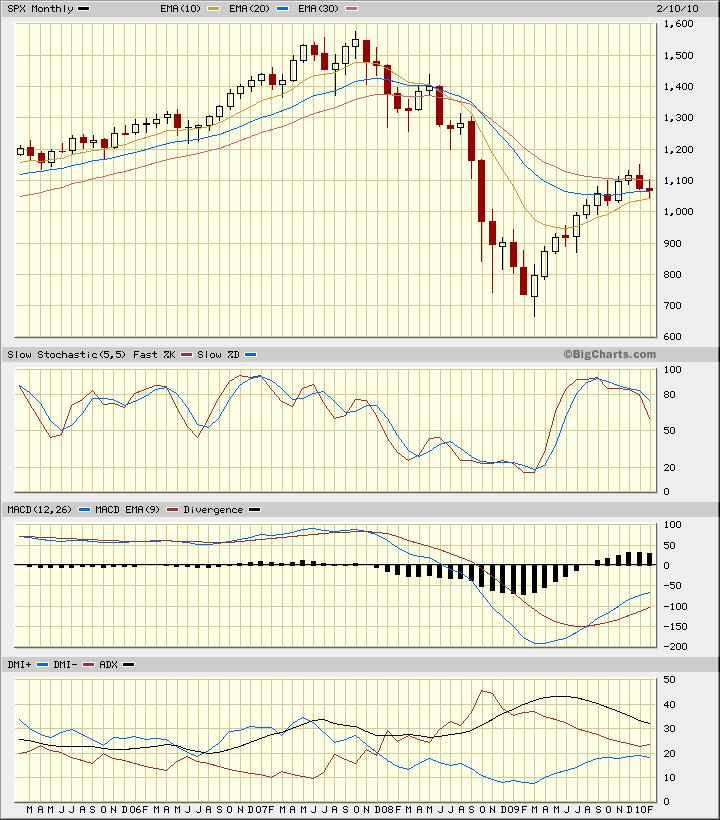
Leob, if possible can you upload newer version of your chart. Let see how the market and indicators are doing now
all this volatility is scaring me
What is interesting is that we are getting these large 30 min red hammers at the RHT open followed by large buying moves that are below the fib retracement lines.
Ak, the latest monthly bar is currently forming a spinning top, ie. consolidation from a big down move of the previous bar. At the moment the market is 'directionless'. It will be interesting to see the form of this bar when its completed. If it will close below the low of the previous bar and below 1000 level, the next stop is 900. This is the level of large trading volume.
(Shsssh Feng, volatility is the bread and butter of daytraders. Everytime the daily market is in consolidation phase, we are happy well, for me anyway).
Unfortunately my trading method works less well the more volatile things are.
Originally posted by leob
Re: SP Monthly chart
Looks like we are in the early stage of the B leg of the ABC correction. It is possible, judging by way things are going, the 666 level will be tested.
Your thoughts?
I think we'll break 666 and go well below it.
http://www.mypivots.com/Board/Topic/5423/1/great-depression
297/386 peak2/peak1 of Great Depression = 76.9%
1147/1576 peak2/peak1 of Great Bankers Bear = 72.8%
I haven't worked out the final low yet. Next pause in the downward carnage 1016 (we are now topping=> in this 1077.5-1081.5 area (resistance of 27 Nov 2009).
Frankly with all due respect if we see 935 again I will be amazed.It a level that has an 30 min. evening star. The financial jitter this level would creat would be worth reading.
Looks like the big traders have decided to prove us (technical analysists) wrong and keep going up.
Emini Day Trading /
Daily Notes /
Forecast /
Economic Events /
Search /
Terms and Conditions /
Disclaimer /
Books /
Online Books /
Site Map /
Contact /
Privacy Policy /
Links /
About /
Day Trading Forum /
Investment Calculators /
Pivot Point Calculator /
Market Profile Generator /
Fibonacci Calculator /
Mailing List /
Advertise Here /
Articles /
Financial Terms /
Brokers /
Software /
Holidays /
Stock Split Calendar /
Mortgage Calculator /
Donate
Copyright © 2004-2023, MyPivots. All rights reserved.
Copyright © 2004-2023, MyPivots. All rights reserved.


