Price Support Resistance
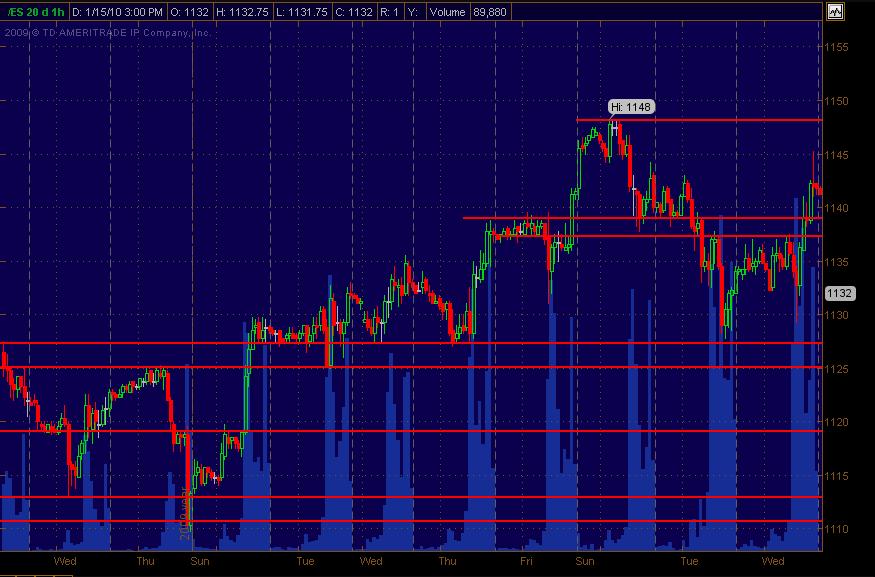
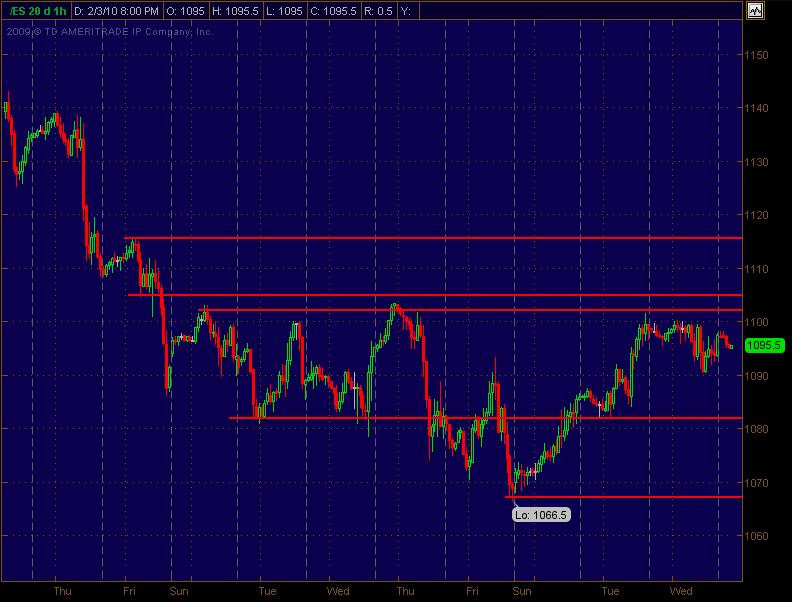
Main focus is currently on stock trades but always following the ES among other things for market analysis. I always draw in S/R lines on the ES. The first chart is what I drew in as of Wednesday's close. Simply eyeballed it and drew in the red horizontal lines. If 2 lines are within a couple of points of each other I view that as a "zone." And all S/R lines are in effect a tiny zone give or take a couple ticks.
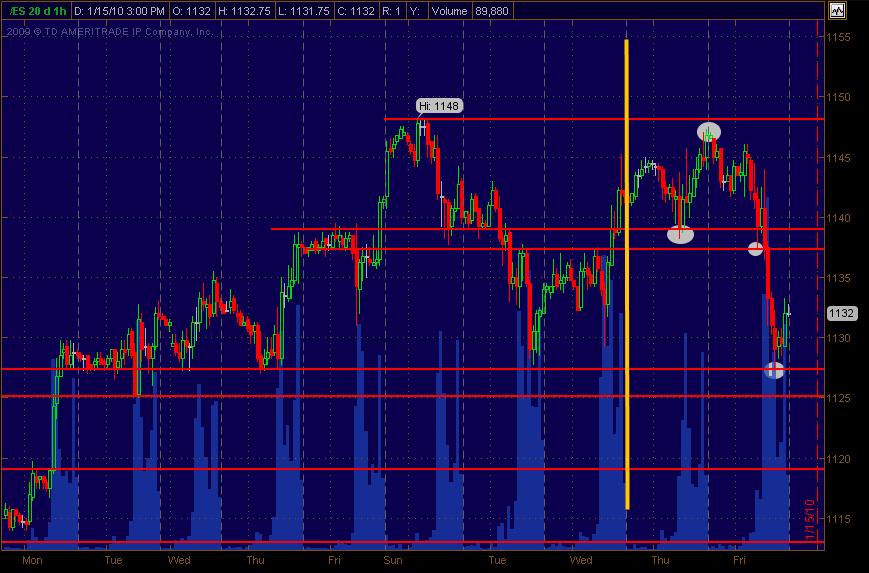
At the close Friday I nabbed another screenshot of the same chart where I'd drawn a vertical yellow line at Wednesday's close so that the following 2 trading days can be seen. It's an hourly chart. I circled in white the price swings where they react off of these areas of price S/R.
Just tossing this out since I see this all the time and could be incorporated or folded in to so many other strategeries or trading analysis and styles.
Would like to hear and see how others employ what I call PASR lines ... Price Action Support Resistance ... in their own trading with as much specificity and any xtra info. This sh@t's been around since before Dinosaurs and the Big Bang ... but thought it might be interesting to explore ideas of how it's effectively employed in the current market. Hope that makes sense.
The following 2 days of price action after Wednesday's S/R lines drawn.
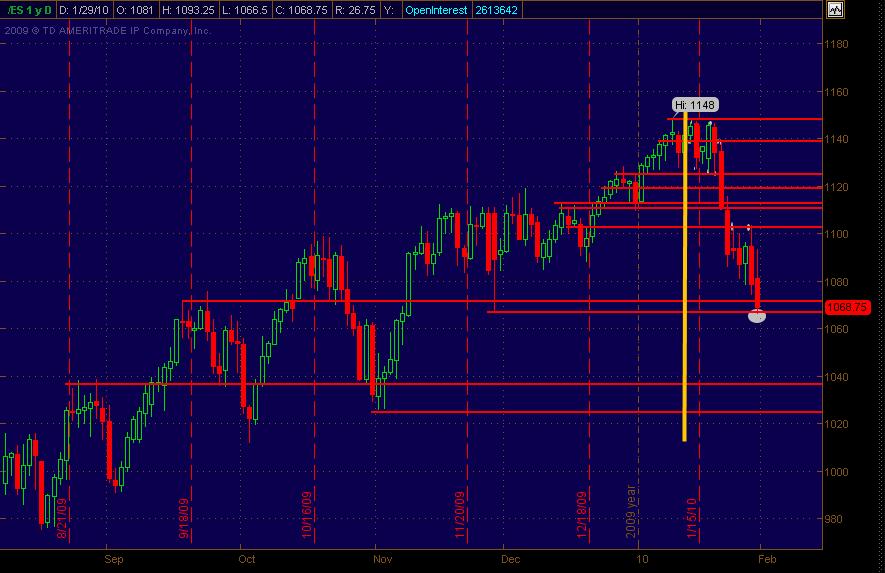
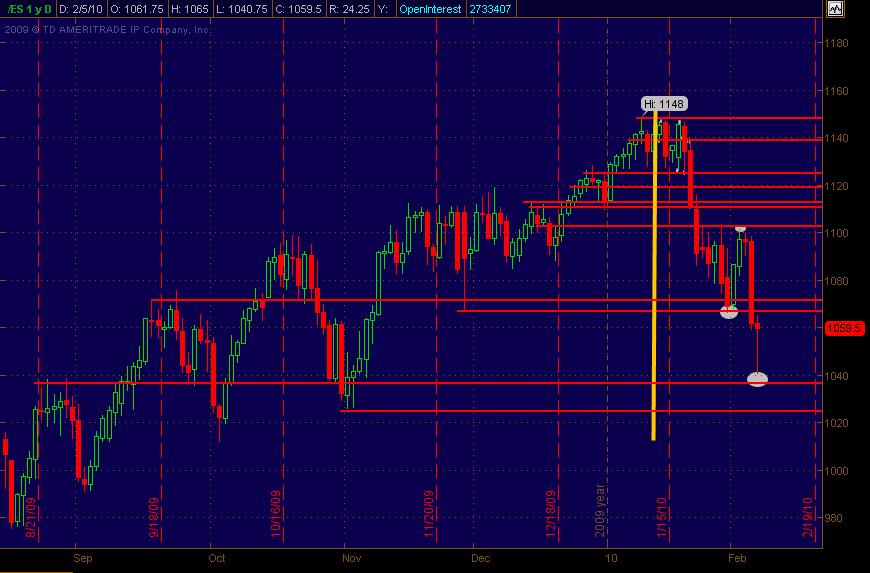
Just a continuing update with a DAILY chart with the red S/R price zones. I drew these in weeks and months ago and haven't changed or adjusted them. Today's (Friday) price moved down to the 1067 line. Obviously there are a couple of price lines drawn in below that which I've had on the chart forever-and-a-day.
Anyway, just wanted to post the chart hoping it'll eventually draw some additional input for how folks may trade around and with these kinds of price S/R levels, whether trading the ES or trading stocks and basing their entry/exit in part on what the SP-500 index is doing and where it is with these S/R lines/zones.
Anyway, just wanted to post the chart hoping it'll eventually draw some additional input for how folks may trade around and with these kinds of price S/R levels, whether trading the ES or trading stocks and basing their entry/exit in part on what the SP-500 index is doing and where it is with these S/R lines/zones.
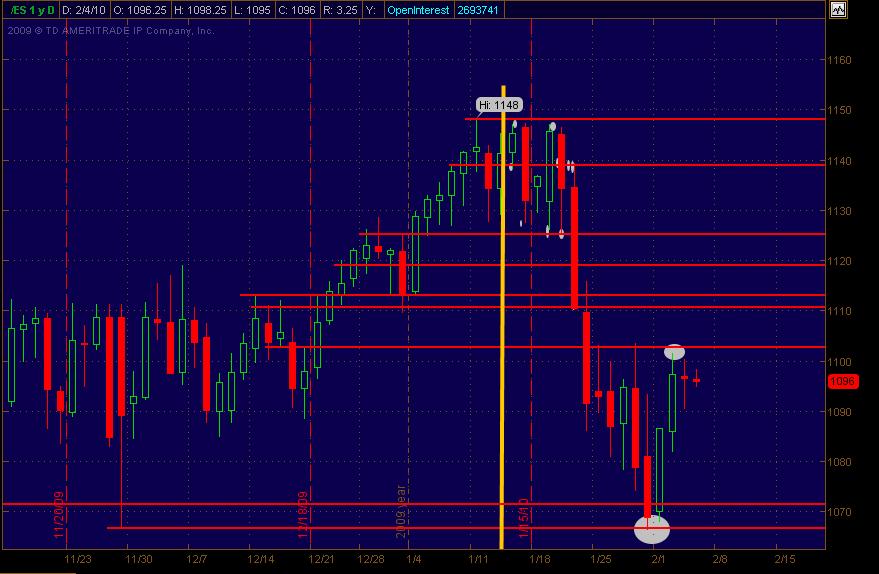
Okay ... just wanted to update ... same S/R lines with an additional week's worth (roughly) of daily bars. Obviously there's updating to be done with new forming levels, but just wanted to keep this straightforward, simple and to-the-point. Any comments welcome, as usual!
To get the best sense of things on the topic and the "mapping" of S/R price areas, quickly breeze through the thread from the beginning ... especially looking at the charts of snapshots going forward in time.
MM
MM
Thought I'd also include an hourly chart with S/R lines. Compare it to ther prior Daily chart. What's important is to see where the swings and intraday s/r levels are as well. Just tossing out more info.
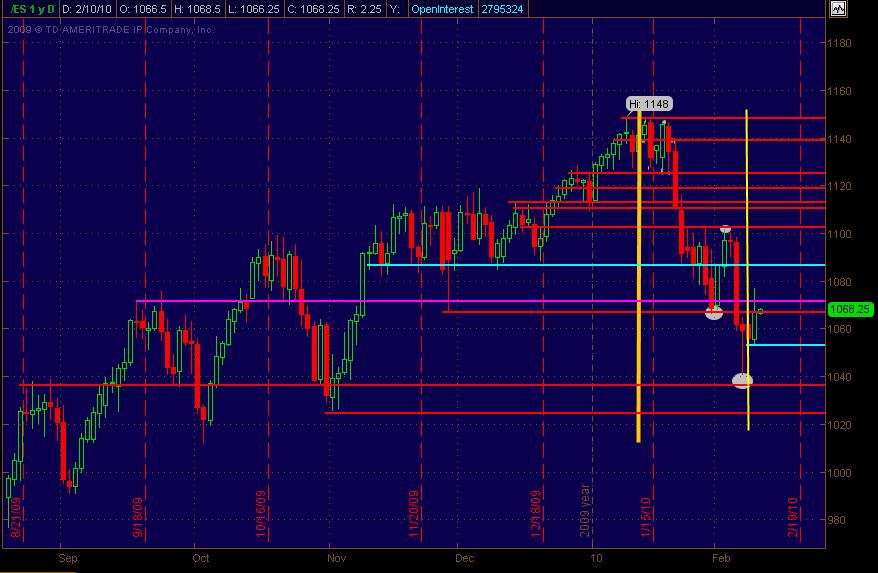
And here's the same DAILY chart with no additional or new PASR red lines drawn in since where the day of where the vertical yellow line is drawn (actually even before then). Just figgered I'd update the thread fwiw. This is going on a month now. Hope this thread is at least an idea generator or helpful in some way(s) to folks!
Further update on the daily ES chart. I've drawn in what are "new" price S/R levels, at least to my eye. They are both in Cyan. And one of the prior S/R price levels is, for the most part, now negated. I simply changed its color to Magenta (just for future reference purposes).
The idea is that I wanted to share/communicate a dynamic updating - the process. The 2nd yellow vertical line represents the time and place on the chart where these 3 changes in S/R levels were mapped. Meanwhile, all other prior Red lines are still intact as what look like reasonably significant S/R prices.
The idea is that I wanted to share/communicate a dynamic updating - the process. The 2nd yellow vertical line represents the time and place on the chart where these 3 changes in S/R levels were mapped. Meanwhile, all other prior Red lines are still intact as what look like reasonably significant S/R prices.
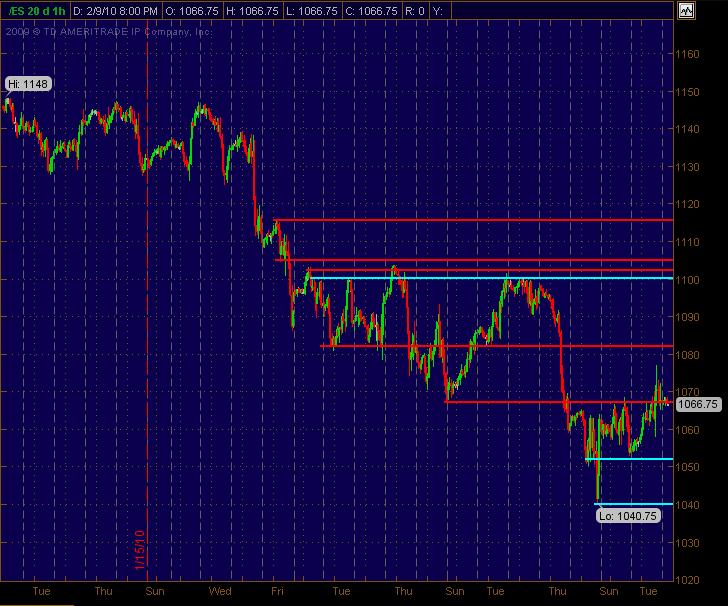
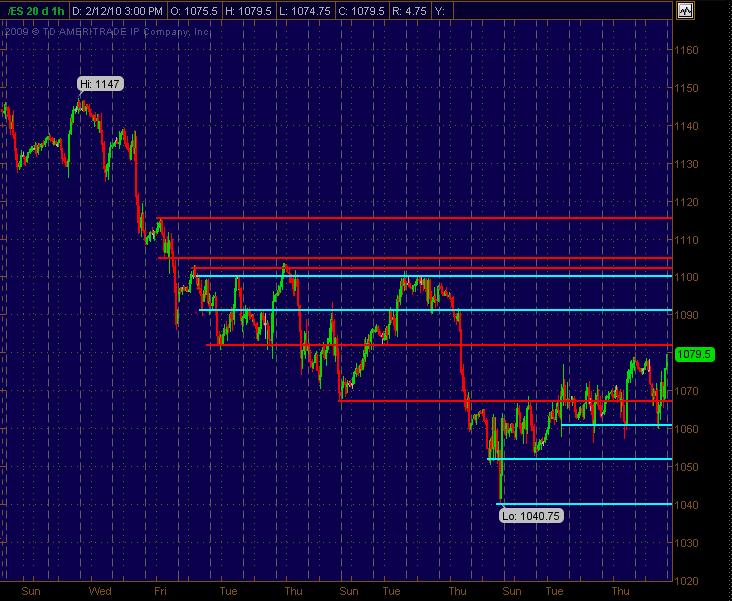
Also, am posting S/R price lines on the 1-hour ES chart, updating the previously posted hourly chart(s). Drew in 3 new S/R lines in Cyan. The one at 1100 also has a couple of Red lines still intact above it up to 1105. So, that is a 5 point range in effect. My read is that if/when price gets up to that area, I'm more focused on the 1100-1102 and how price trades into that tighter "zone" ... and yet still consider 1105 as a possible more extreme Resistance Level above.
Although not drawn in ... 1091 is a more minor potential S/R level.
Any and all input and feedback and sharing is welcome and encouraged!!!
Any and all input and feedback and sharing is welcome and encouraged!!!
1061 and 1091 are now new S/R levels I'm seeing on the ES 1-hour chart ... and have drawn them in with Cyan color. Posting the same chart as I've posted all along in the thread, but with these updates. All other Red S/R levels still "active."
I've been doing the same for year with my trading. I take my s&r numbers from a 10 and 30 min chart and look for confluence on 120, and 200 min charts. I keep a dry erase board and assign each pivot a strength rating and color code them on my chart. Depending on the market I usually rest orders a tick above/below. The intial trade is for a scalp only with a tight stop. If there are other close pivots or if it's a fairly busy area, I wait for a set up. I must have confirmation for the before taking a position in either direction. I use to leave resting orders on all, but taking heat is something I now avoid as much as possible since my 4x bypass surgery last year. If I miss a trade, I miss a trade. Also, I use Fibs to look for another layer of confluence.
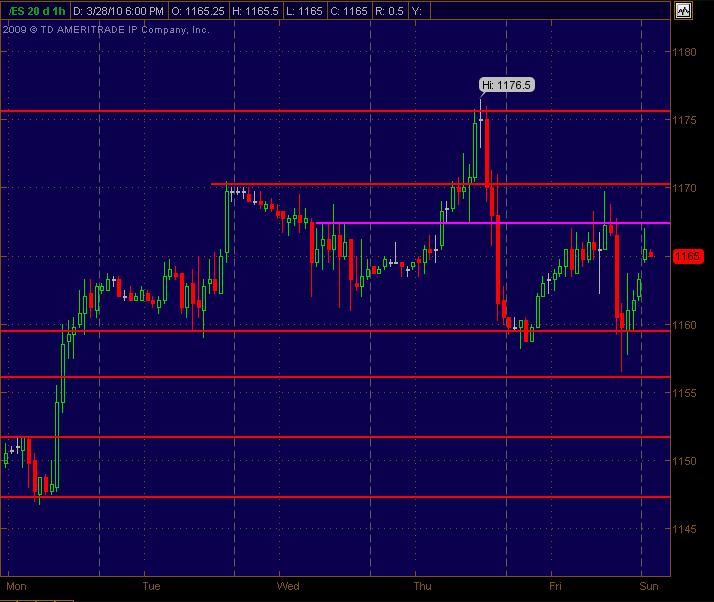
Here's an update of Price Action S/R levels for the ES coming into Monday 3-29-10. I looked at a bunch of daily equity charts and really wasn't turned on for many longs (or shorts) ... mixed. That's what I've seen the past few days fwiw. And the SP has been "sloppy" trading back and forth intraday for the past few sessions. (even though there have been some decent moves for trades).
Anyway, it still looks choppy (at least to me) now after such a strong and grinding run up the past few weeks ... even on low volatility. Hope this helps as a roadmap with some ideas. As always, open to any and all analysis and feedback.
Anyway, it still looks choppy (at least to me) now after such a strong and grinding run up the past few weeks ... even on low volatility. Hope this helps as a roadmap with some ideas. As always, open to any and all analysis and feedback.
Emini Day Trading /
Daily Notes /
Forecast /
Economic Events /
Search /
Terms and Conditions /
Disclaimer /
Books /
Online Books /
Site Map /
Contact /
Privacy Policy /
Links /
About /
Day Trading Forum /
Investment Calculators /
Pivot Point Calculator /
Market Profile Generator /
Fibonacci Calculator /
Mailing List /
Advertise Here /
Articles /
Financial Terms /
Brokers /
Software /
Holidays /
Stock Split Calendar /
Mortgage Calculator /
Donate
Copyright © 2004-2023, MyPivots. All rights reserved.
Copyright © 2004-2023, MyPivots. All rights reserved.
