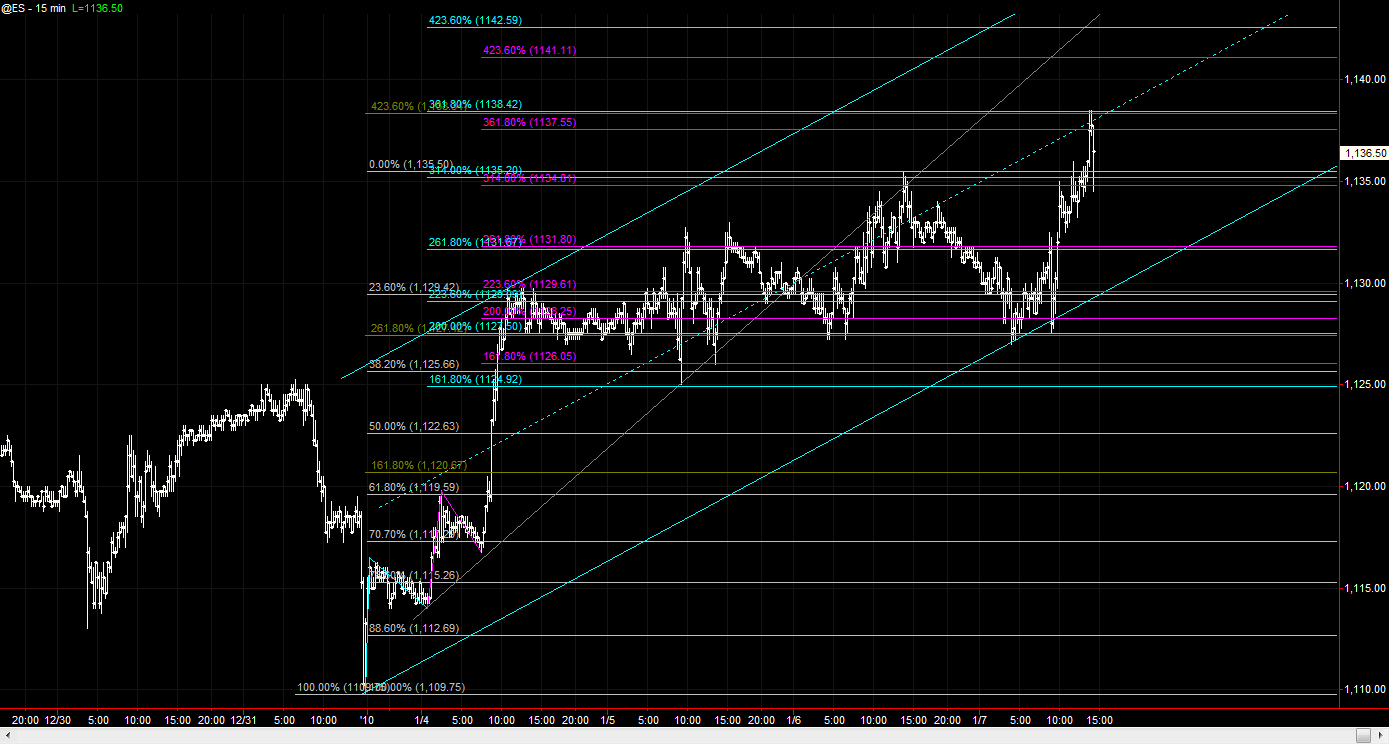
ES 10-07-10
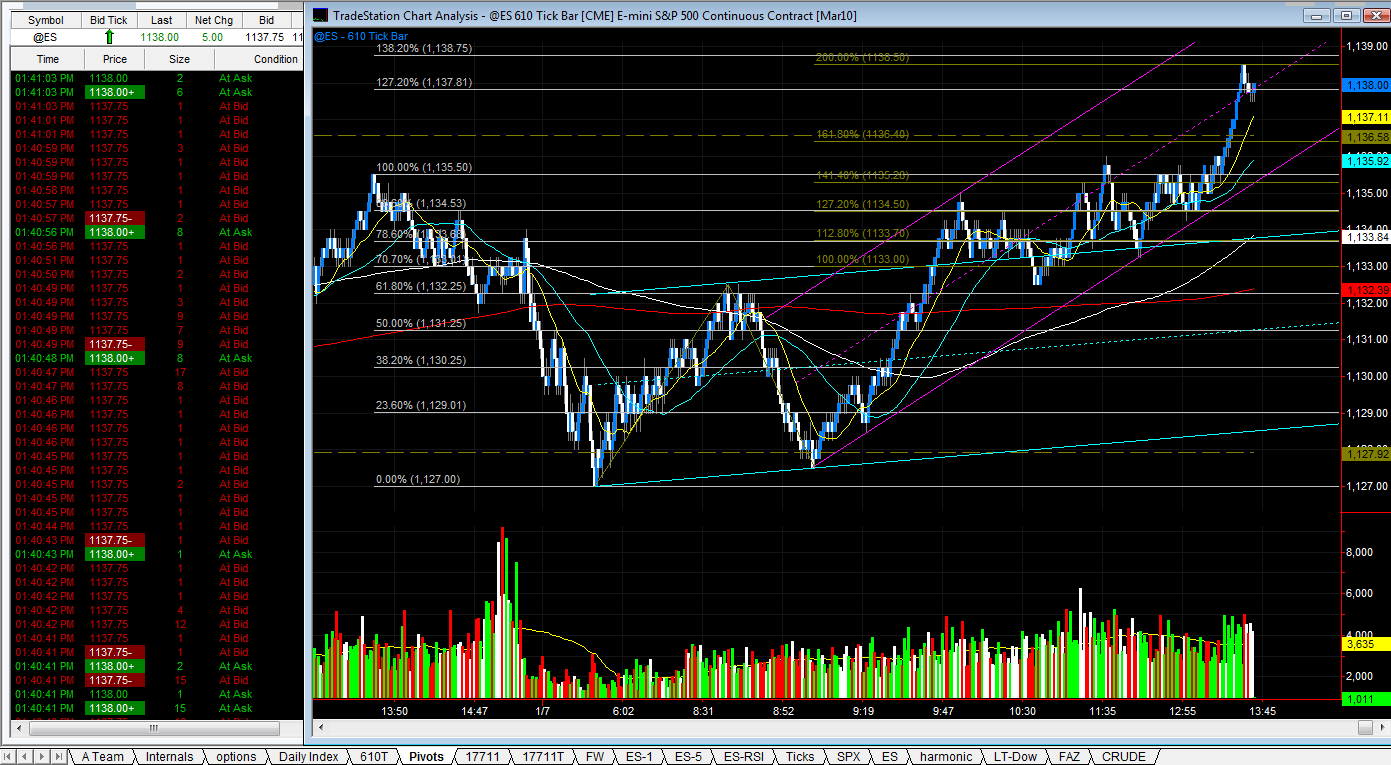
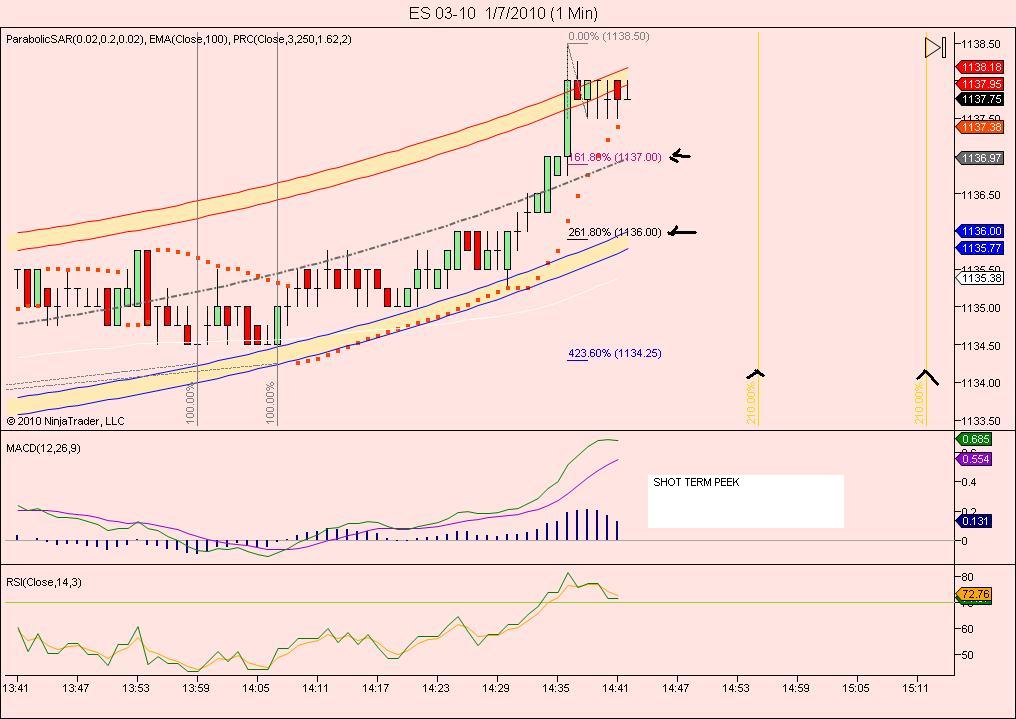
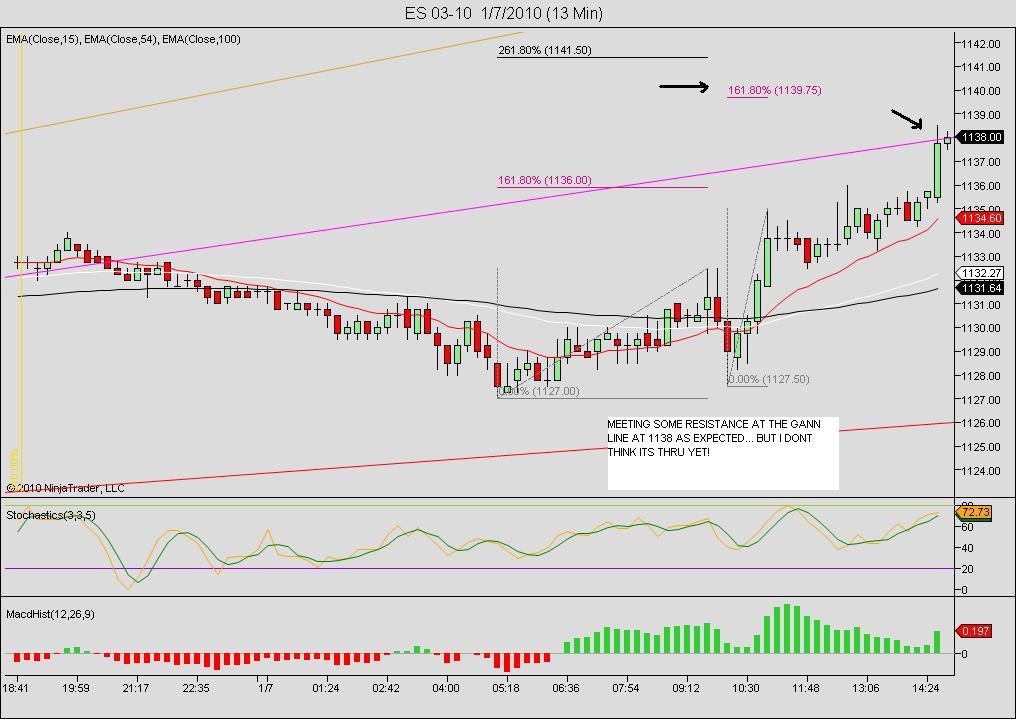
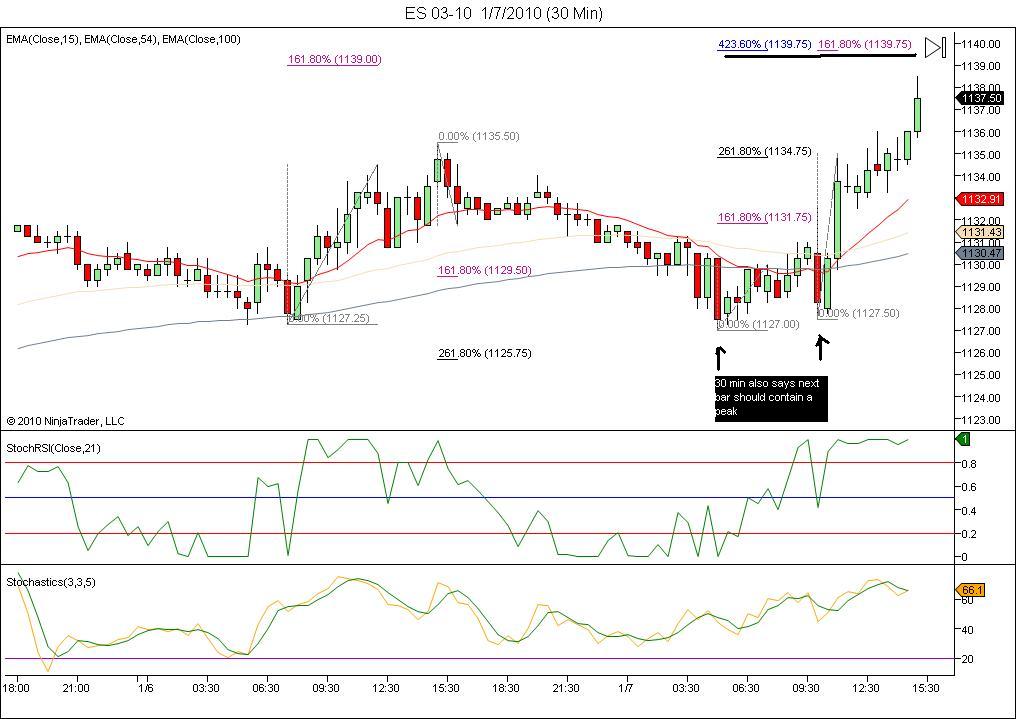
Well, not much changed overnight , same targets apply. The only difference i see is that both the 5 min and the 13 min mov avg's have changed to a bearish posture.
Hate trading this late ,but 1139.75 looks like a decent short....
161.8 = 1140.75
Originally posted by VOwater261.8 3rd wave projection = 42
161.8 = 1140.75
it shouldnt, but if that were to occur today.. i'd buy puts on the spy! thats the area i was looking for if 1133 gave way!
wow, first one min cycle top hit daed nuts.. the other is due around 11 or 12 after...
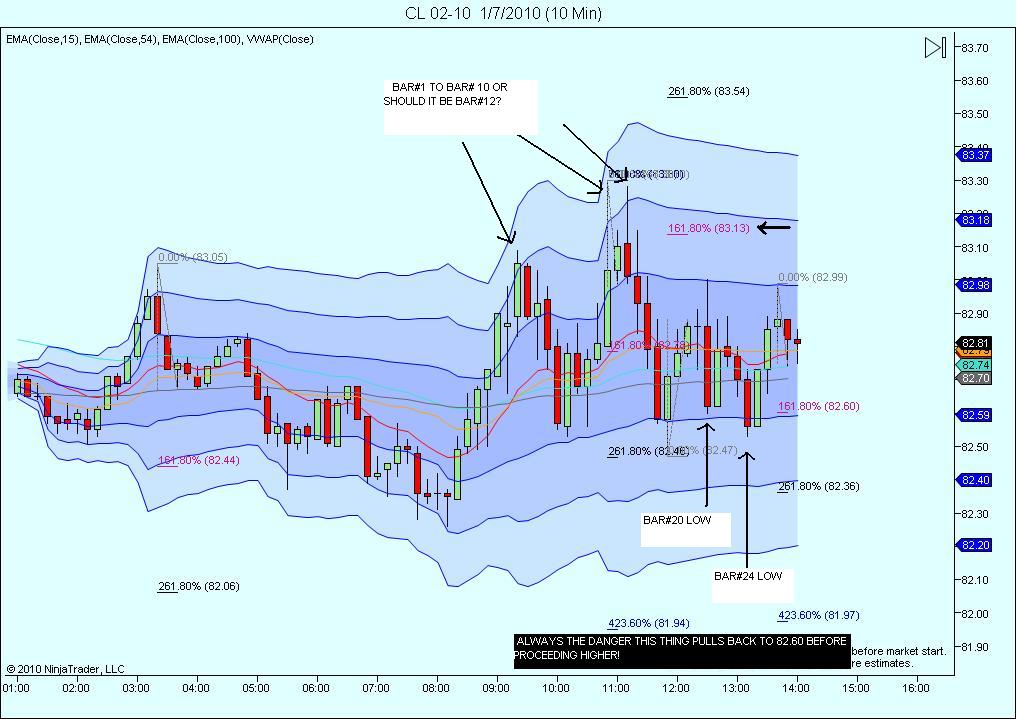
Originally posted by koolblue...sure Einstein... see the chart? see the obvious support around that 82.60 level? And notice the 2 lows i have marked.. after the second one it seemed to me it would be natural to test the upper boundry around 83.10 or so. i had the projection to 83.13 and a short term chart saying 82.97 minimum! when i saw this we were around 82.69... a few seconds later ,it started to take off so i just pulled the trigger for a market fill.Hence my entry.too bad it was so late
Emini Day Trading /
Daily Notes /
Forecast /
Economic Events /
Search /
Terms and Conditions /
Disclaimer /
Books /
Online Books /
Site Map /
Contact /
Privacy Policy /
Links /
About /
Day Trading Forum /
Investment Calculators /
Pivot Point Calculator /
Market Profile Generator /
Fibonacci Calculator /
Mailing List /
Advertise Here /
Articles /
Financial Terms /
Brokers /
Software /
Holidays /
Stock Split Calendar /
Mortgage Calculator /
Donate
Copyright © 2004-2023, MyPivots. All rights reserved.
Copyright © 2004-2023, MyPivots. All rights reserved.
