ES 1-5-10
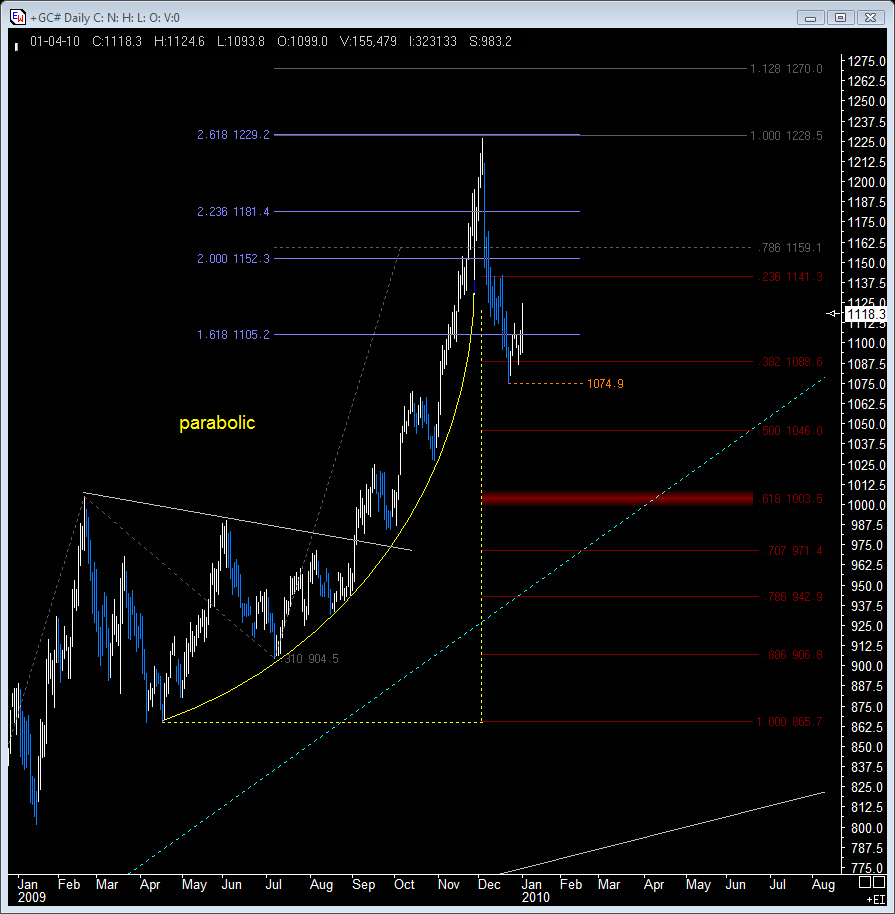
This is an important time frame... look at the averages on the above chart. They are dangerously close to turning negative.
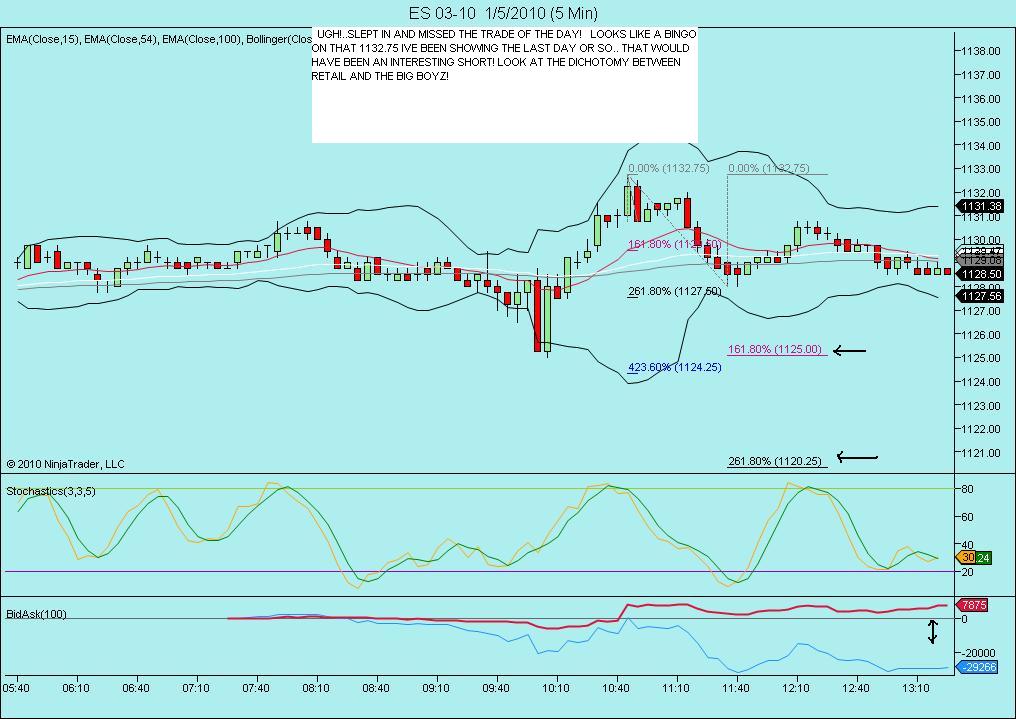
initial targets on the downside are shown... if by some chance the rally this week is not over then i'll be watching for 1138 tho there is significant resistance at 1135.25-1136
well, i missed the 1132.75 level, the trade of the day! Now im watching 1130.50 for a sell or 1125.00 for a buy!
In a larger context, followers will note that that 1132 area was my first area for a possible fade after the breakout!The chance of an intermediate decline is very real here.time will tell!
order in at 1125.25
L 26.50...stop 24
Almost joined you ,pal! Still hope for one more push lower, but that last one probably completes a wave count...
this looks like a lil triangle 4 wave
Emini Day Trading /
Daily Notes /
Forecast /
Economic Events /
Search /
Terms and Conditions /
Disclaimer /
Books /
Online Books /
Site Map /
Contact /
Privacy Policy /
Links /
About /
Day Trading Forum /
Investment Calculators /
Pivot Point Calculator /
Market Profile Generator /
Fibonacci Calculator /
Mailing List /
Advertise Here /
Articles /
Financial Terms /
Brokers /
Software /
Holidays /
Stock Split Calendar /
Mortgage Calculator /
Donate
Copyright © 2004-2023, MyPivots. All rights reserved.
Copyright © 2004-2023, MyPivots. All rights reserved.


