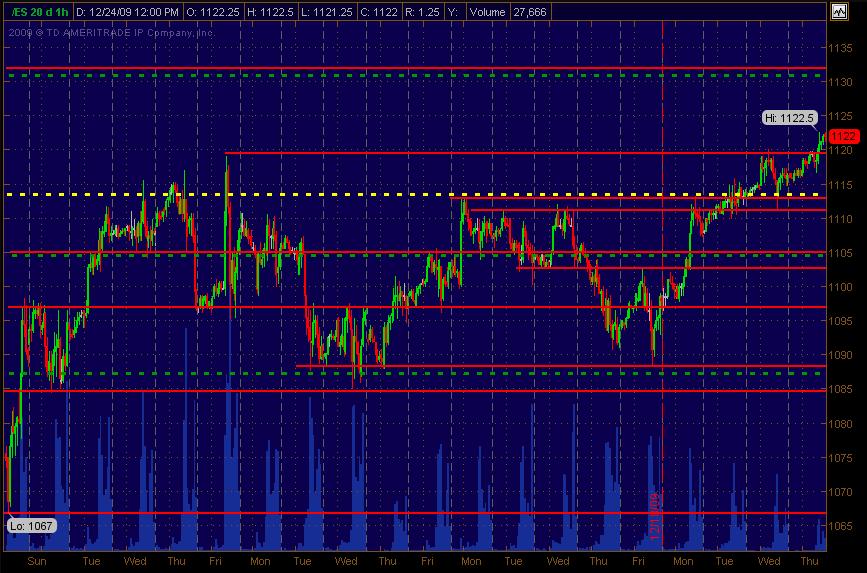
ES S/R Map for post X-mas
For anyone dipping their trading toe into the icy cold water during the holiday season, here's a Christmas day chart of S/R price action levels ... the solid red lines.
The dashed lines are Wkly Pivot prices ... Yellow being Mid Pivot and dashed Green lines being the S/R pivot levels above and below the Mid Pivot. Any feedback and aditional analysis always welcome.
Merry Christmas (still) as I post this at apprx. 10:30 central time. Hope all are well and having fun with family and friends now! Peace!
Your upper red line is holding it back quite well so far MM......I'm liking the sell side this week but so far the market still seems lifeless......Tomorrow I'm hoping is the big trend day and down....thanks for taking the time with this chart
Emini Day Trading /
Daily Notes /
Forecast /
Economic Events /
Search /
Terms and Conditions /
Disclaimer /
Books /
Online Books /
Site Map /
Contact /
Privacy Policy /
Links /
About /
Day Trading Forum /
Investment Calculators /
Pivot Point Calculator /
Market Profile Generator /
Fibonacci Calculator /
Mailing List /
Advertise Here /
Articles /
Financial Terms /
Brokers /
Software /
Holidays /
Stock Split Calendar /
Mortgage Calculator /
Donate
Copyright © 2004-2023, MyPivots. All rights reserved.
Copyright © 2004-2023, MyPivots. All rights reserved.
