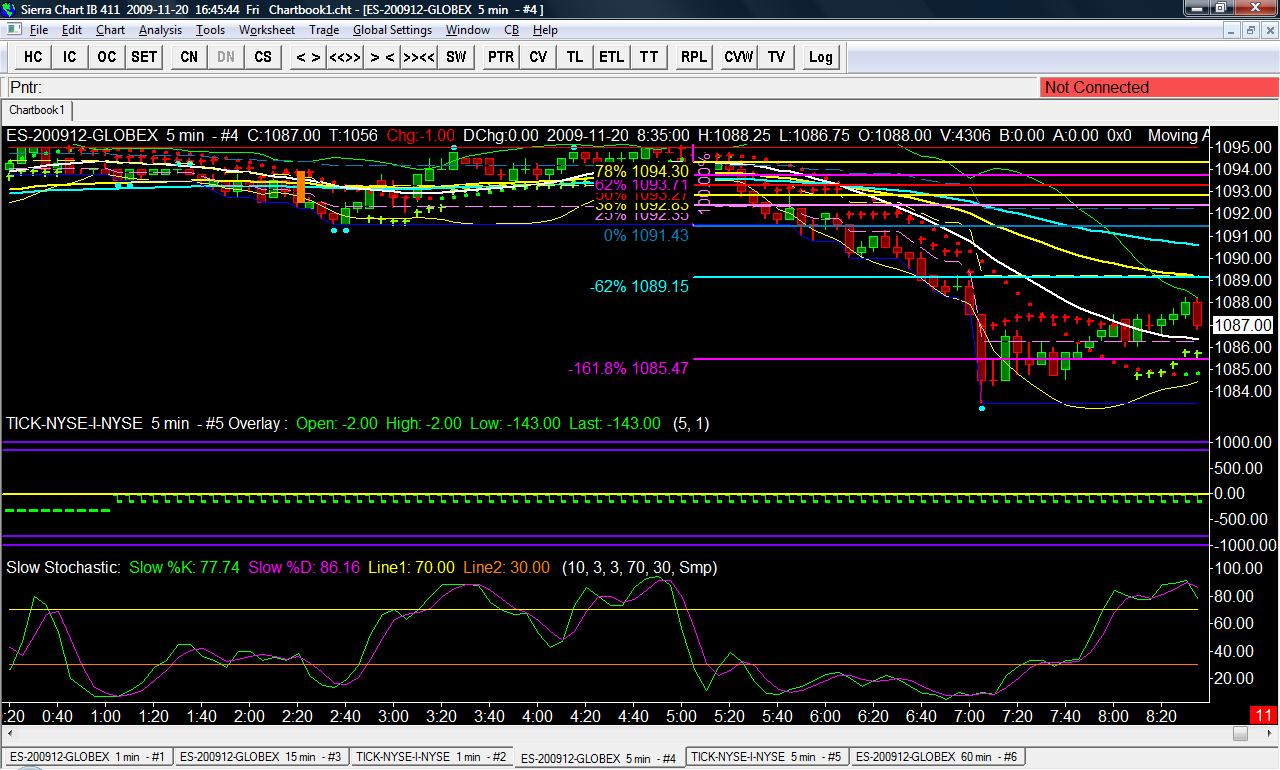
projections 5134
One aspect of Kool's method which is sometimes difficult is making projections. If you look at Kool's chart posted at 8:32 you will see that the downthrust could also been terminated a little higher around 1191.50 at the low of the candle just before the green hammer. Using this projection would have given a 261 projection of 1085.50ish-not as accurate where Kool's projection was but still, not too bad. One would have needed a 3 point stop to survive. I generally use the rule that unless the next candle retraces by at least 50%- the thrust is still on. Maybe this is wrong but it seems to work pretty well. Any comments welcome.
here's a chart for clarification. note: I use fib from beginning of the move, so my 62 is equivalent to Kools 161 and my 161 is equivalent to Kools 261.
You raise a great issue Einstein . How much retrace? I have found that i have loosened up on my parameters to around 50% also lately . I used to use 25% or so but found it too retrictive.
Emini Day Trading /
Daily Notes /
Forecast /
Economic Events /
Search /
Terms and Conditions /
Disclaimer /
Books /
Online Books /
Site Map /
Contact /
Privacy Policy /
Links /
About /
Day Trading Forum /
Investment Calculators /
Pivot Point Calculator /
Market Profile Generator /
Fibonacci Calculator /
Mailing List /
Advertise Here /
Articles /
Financial Terms /
Brokers /
Software /
Holidays /
Stock Split Calendar /
Mortgage Calculator /
Donate
Copyright © 2004-2023, MyPivots. All rights reserved.
Copyright © 2004-2023, MyPivots. All rights reserved.
