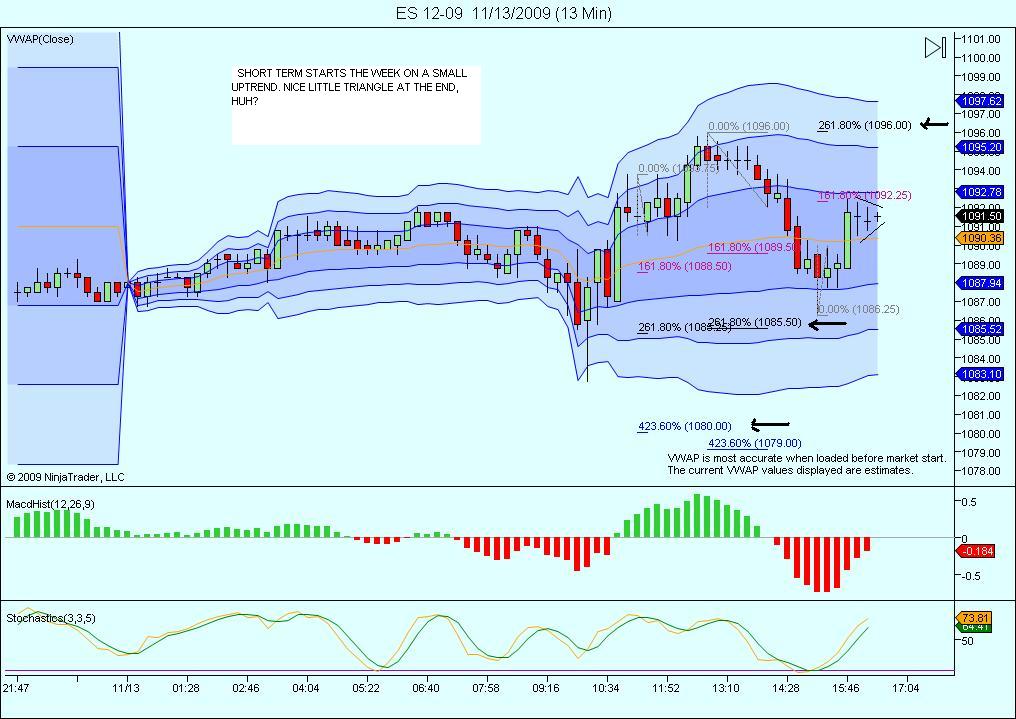
WEEKEND UPDATE 11- 14-09
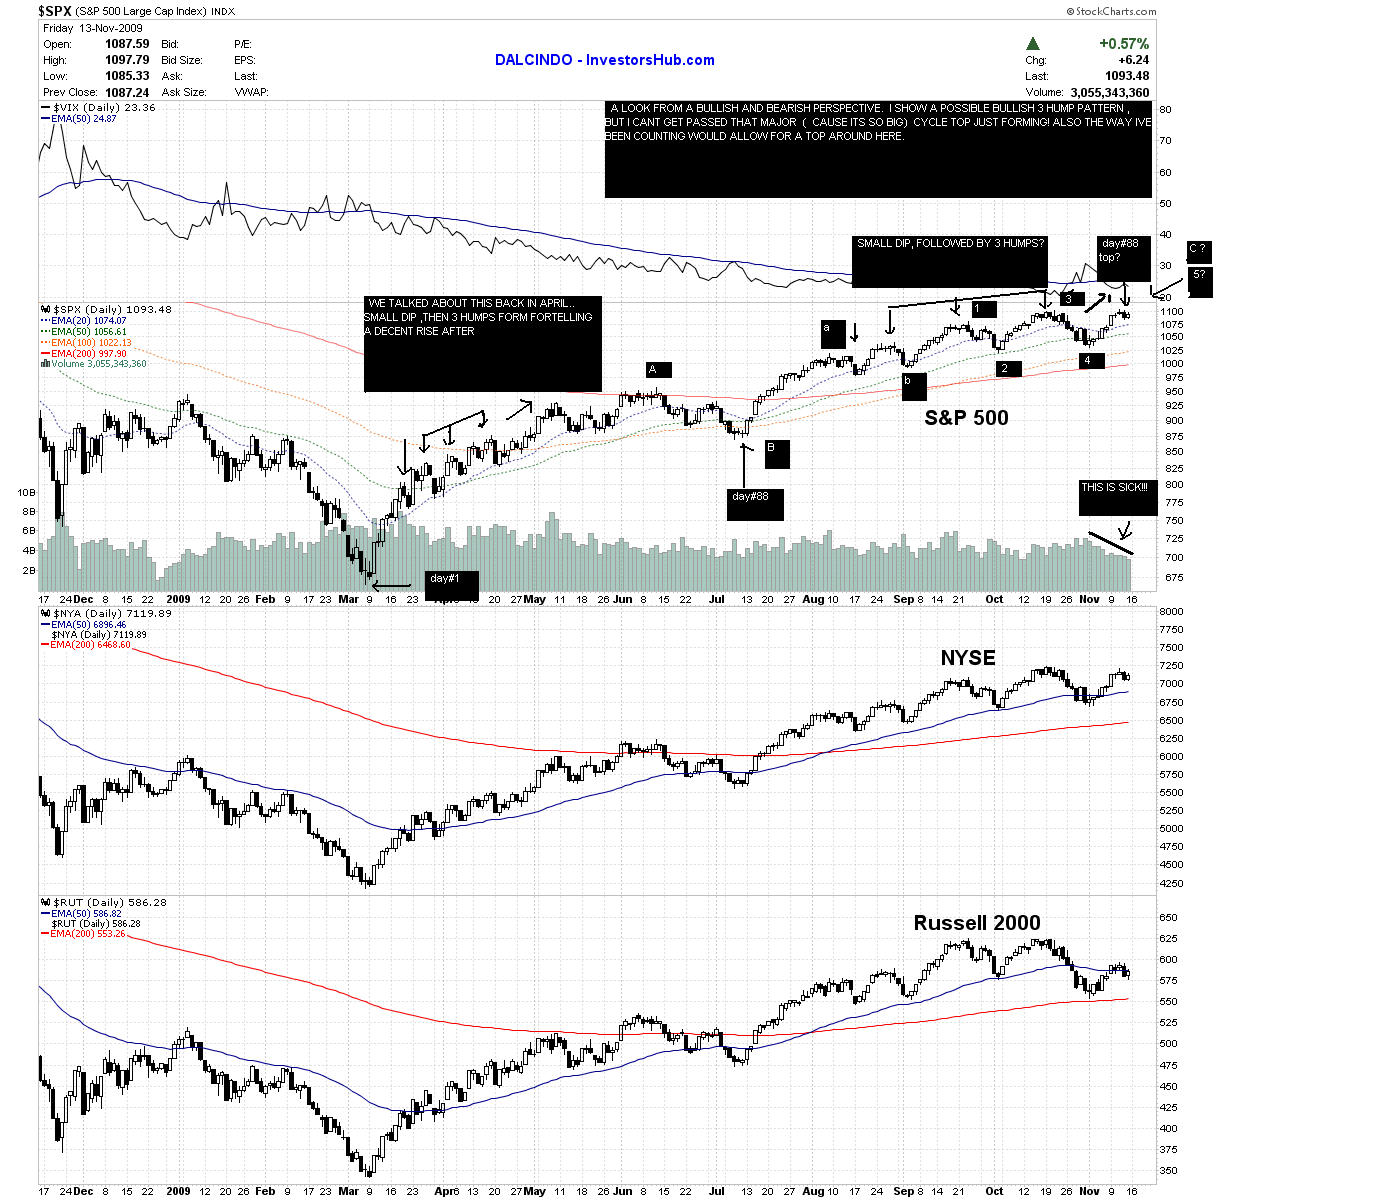
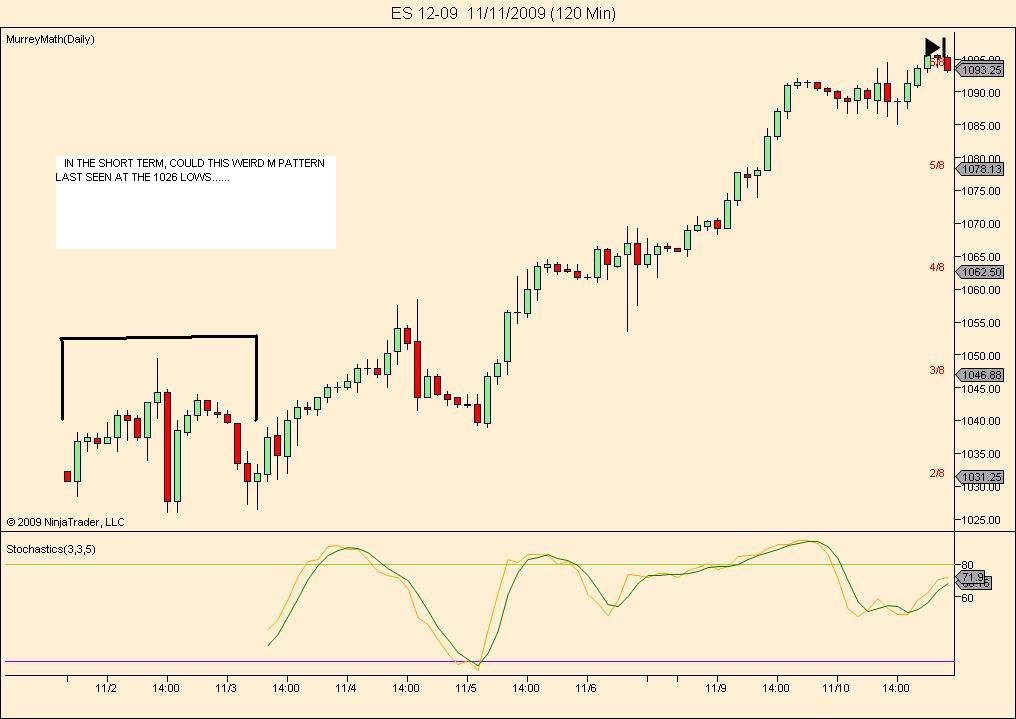
WOW, The markets are fun again! We always get good action in the fall! Was late Oct,early Nov. a great buying opportunity? (a la 1026!) , or are the bears about to seize control , right in the face of the powerful upside seasonals just like they did in Oct- Dec 07! What makes now so much fun is i feel we are at a very crucial juncture in the market, in which a good case can be made either way for the intermediate to long term!
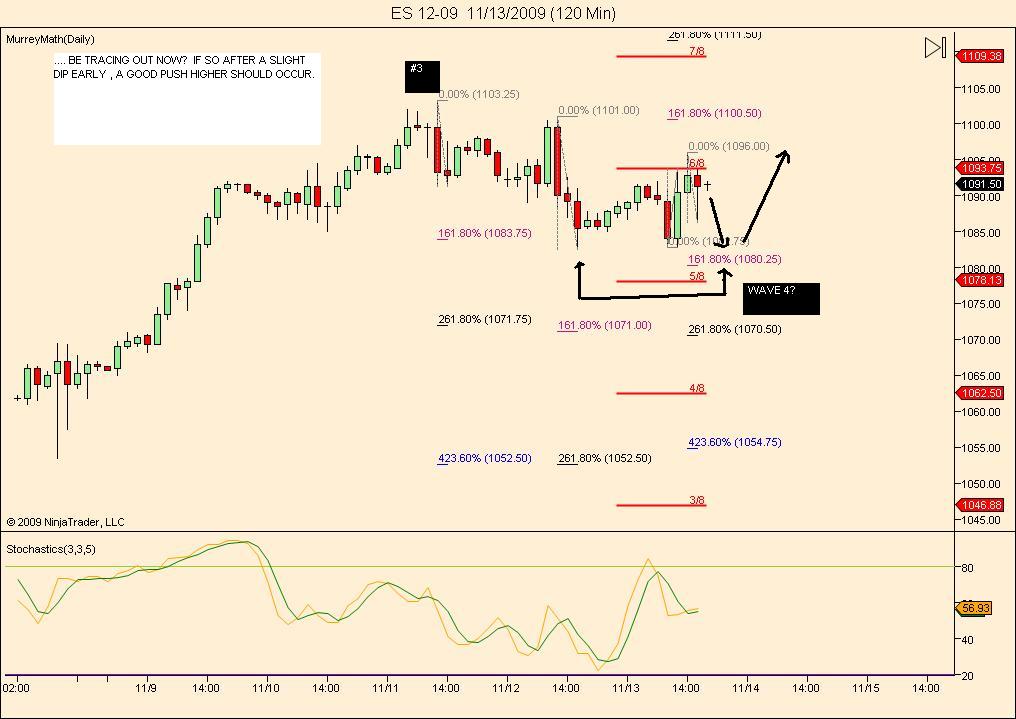
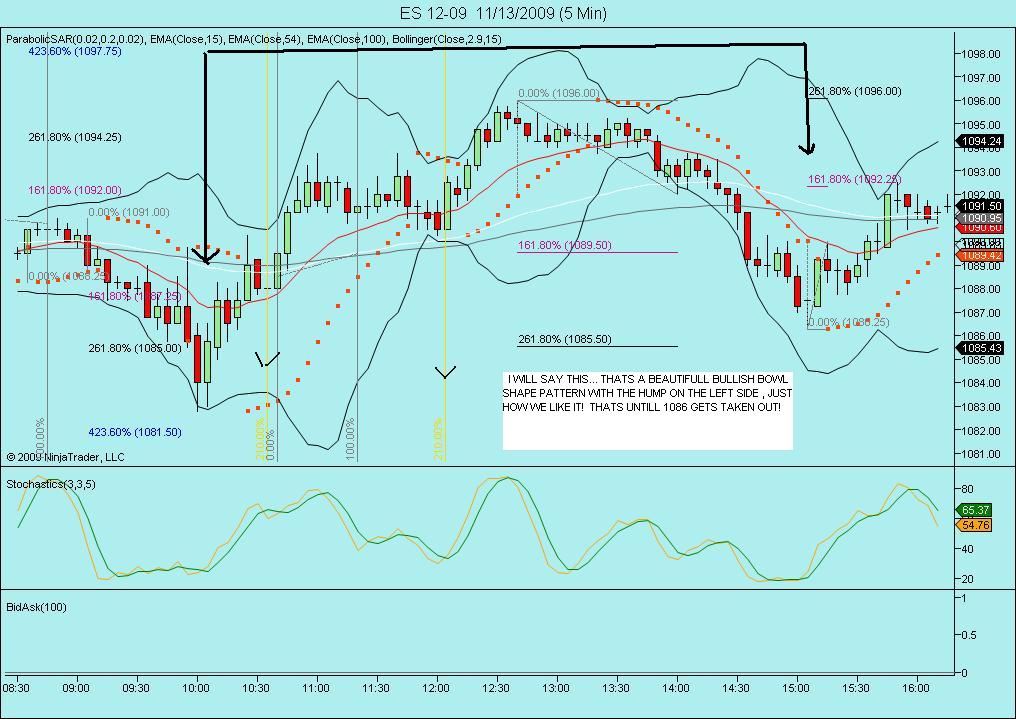
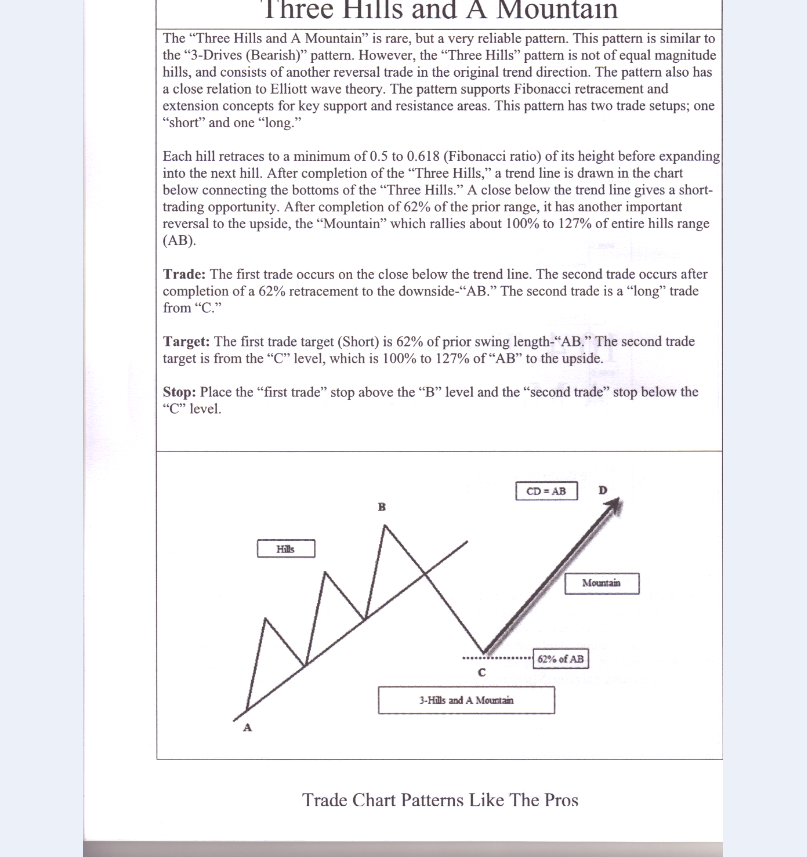
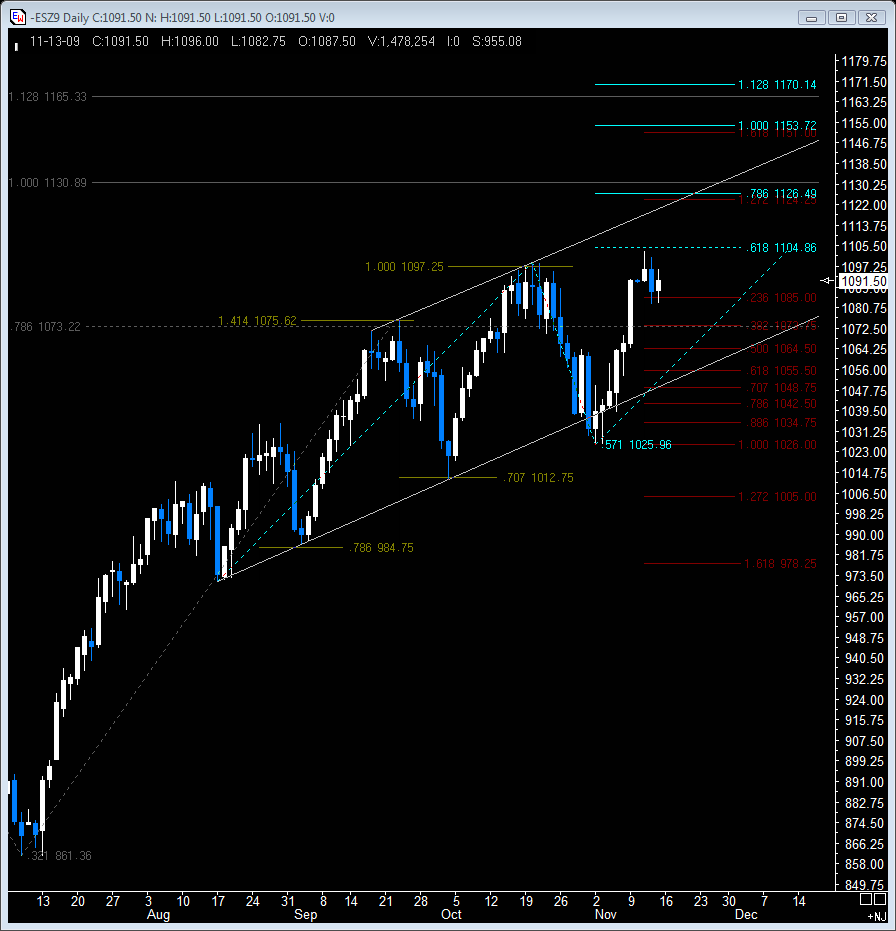
O/N THE PLUS SIDE: you have the bullish seasonals , price action, (the market is bullish untill it proves otherwise.. and it hasnt yet!), and bullish patterns (3 humps and point and figure projections). Also from a kools tools perspective ,much higher projections are possible (1170, 1200?). you have a still crappy but slowly improving economy, and longer term cycles that dont peak untill Mar.2010. also remember the new highs -lows charts were exactly in the same area last seen at the major bottom in July ! As long as unemployment stays lousy, tying the feds hands on raising rates, and the king dollar stays low, the impetus is up.
O/N THE BEARISH SIDE: WOW, I could go on for an hour here, but just some highlights. The technical indicators are negatively diverging badly on the daily charts, starting to on the weekly. breadth and volume on the rally, especially lately, has been anemic! Kools tools shows the potential for an important peak around here, and although we just had a nice price decline down to 1026 , im not sure enough time has gone by for a significant advance. The advance / decline chart just made a lower top at last weeks higher top (1103.25)on the es! This is the first time since March! I could go on and on. Tho i fully expect higher prices by next spring, my gut is telling me to be VERY CAUTIOUS here!!!
This a exciting time of year to trade! Please feel free to comment , or post ANY opinions, as all are welcome and encouraged! What do you think...?
B
e sure to click on the image!,,Especially the top one cause theres some stuff on it you cant see!!!
e sure to click on the image!,,Especially the top one cause theres some stuff on it you cant see!!!
Just to make sure that everyone knows there's also a horizontal scroll bar below the images if you need/want to scroll to the left and see the left side of the chart. The scroll bar is only there if the chart is too wide for the screen.
You can also click the Image as KoolBlue suggested and that will bring up the full size image in a new window.
You can also click the Image as KoolBlue suggested and that will bring up the full size image in a new window.
It's as good a guess as any.
Courtesy Suri Duddella (p.180 Trade Chart Patterns Like The Pros)
Courtesy Suri Duddella (p.180 Trade Chart Patterns Like The Pros)
Emini Day Trading /
Daily Notes /
Forecast /
Economic Events /
Search /
Terms and Conditions /
Disclaimer /
Books /
Online Books /
Site Map /
Contact /
Privacy Policy /
Links /
About /
Day Trading Forum /
Investment Calculators /
Pivot Point Calculator /
Market Profile Generator /
Fibonacci Calculator /
Mailing List /
Advertise Here /
Articles /
Financial Terms /
Brokers /
Software /
Holidays /
Stock Split Calendar /
Mortgage Calculator /
Donate
Copyright © 2004-2023, MyPivots. All rights reserved.
Copyright © 2004-2023, MyPivots. All rights reserved.
