ES S/R Map for 11-12-09
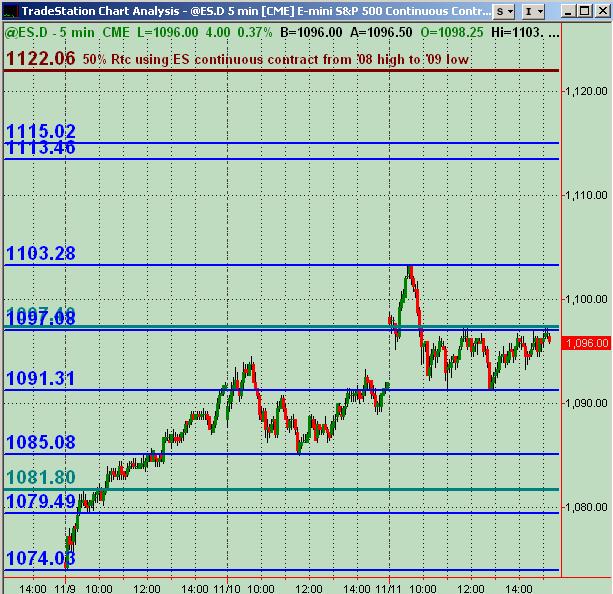
Not much to work off of for price action S/R above the current mkt making 52 week highs. The blue lines are the PASR (price action support resistance) price "zones." The greenish lines are the Wkly R1 and R2 Pivots.
After looking at longer term charts and different front-month contracts and any decent levels that appeared potentially significant ... found the 1113-1115 as a possible one above the market.
Also have drawn in 1122.00, which is roughly the 50% retracement from 2009's low back up to 2008's high using the ES CONTINUOUS CONTRACT (not actual front trading month prices).
Hope this is helpful! And, as always, open to any feedback and analysis and charts from all!
Whoa ... 500th post and another star shows up. So Guy, do I get a doggy biscuit ... or a lump of coal in my Christmas stocking?
Would like some input for any potential levels above the market with analysis and explanation for anyone who has some ideas. If you've not even posted, have a gander ... doesn't matter if wrong or right ... it's about just sharing what you're seeing for now. It's all good, especially if posting a chart ... but if only a description of ideas ... that's totally welcomed too!!!!!!!!!
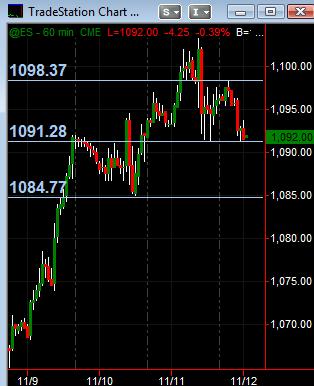
Been trading into the night ... 60min chart with a few S/R price lines ... have shorted some so far with some decent outcomes. Makes for a good picture to combine with the initial post for what's taking place with price action.
PS:... I GOT MORE STARS!...LOL
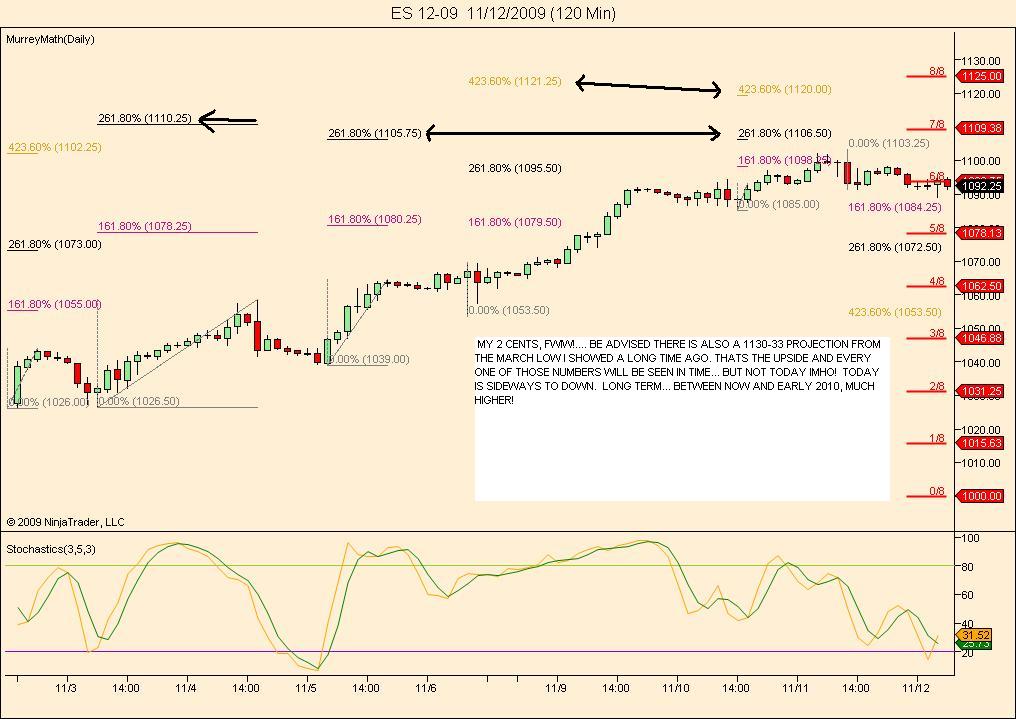
1114 is on my list as well as a good potential pullback zone. Been long since this 93...will jump off some where around those numbers. Made the famous side ways W pattern with the right side spilling lower...on the 60min
Although looking for short term shorts until at least 10ish
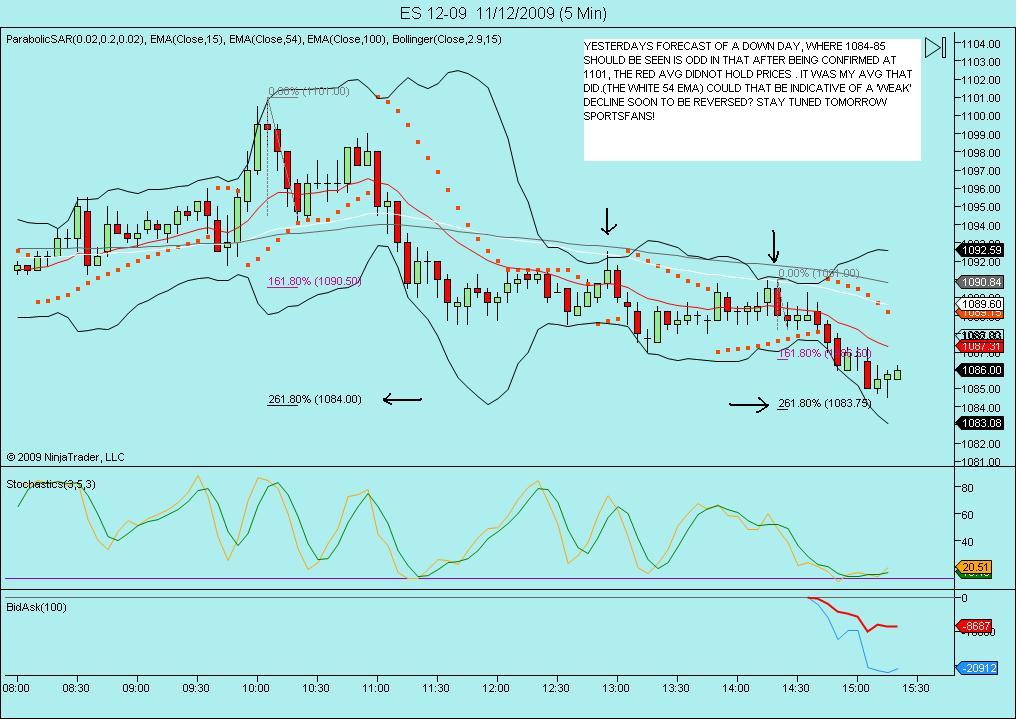
on the 95.50's...short...agressive today for one set of triples...96 wsas key from yesterday...Volume spikes...blah blah blah
R: 1101, 1103, 1106, 1123
S: 1089, 1081, 1073
Sell 'em !
S: 1089, 1081, 1073
Sell 'em !
sorry on last post 97.75 was key volume area ...they see them at the lows...go baby go!!! get those triples!!
Emini Day Trading /
Daily Notes /
Forecast /
Economic Events /
Search /
Terms and Conditions /
Disclaimer /
Books /
Online Books /
Site Map /
Contact /
Privacy Policy /
Links /
About /
Day Trading Forum /
Investment Calculators /
Pivot Point Calculator /
Market Profile Generator /
Fibonacci Calculator /
Mailing List /
Advertise Here /
Articles /
Financial Terms /
Brokers /
Software /
Holidays /
Stock Split Calendar /
Mortgage Calculator /
Donate
Copyright © 2004-2023, MyPivots. All rights reserved.
Copyright © 2004-2023, MyPivots. All rights reserved.


