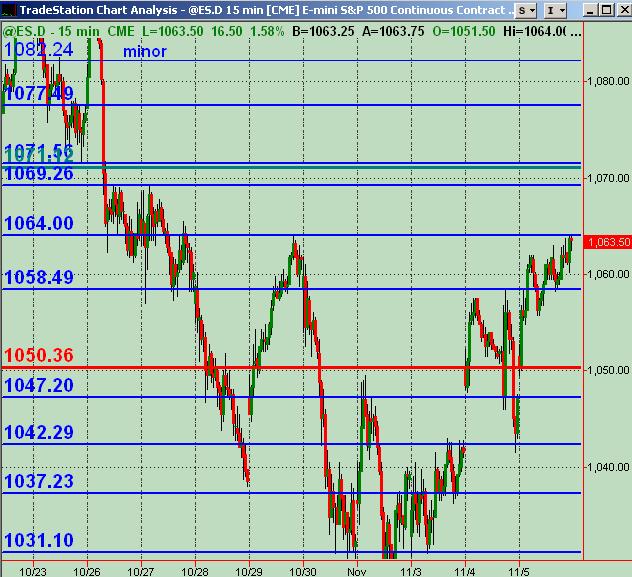
ES S/R Map for 11-6-09
Btw Kool, interesting chart you posted on this page: http://www.mypivots.com/forum/topic.asp?TOPIC_ID=5075&whichpage=3
Here's what I've got for potential significant S/R price areas for Friday using a 15 minute chart. Blue=price action S/R ... Red line is Wkly Mid-Pvt ... Green(ish) line is Wkly R1 Pvt. Pleas offer any and all feedback and analysis and charts etc. !
Jobless report will be premkt ... so may be some interesting gyrations to watch.
ADDENDUM: Not totally cool with that 1058.50 area I drew in on the chart ... so call it potential MINOR S/R level at best.
THX, for the comment Monkey!, i actually like that 1058.50 number especially if it were to get hit before the unemployment numbers (which doesnt seem too likely now). great job,by the way on your charts ! i look forward to seeing them every morning!
Daily Pivots for day following 05-Nov-2009
Classic Woodie Camarilla DeMark
R4 1130.42 1121.83 1077.00
R3 1105.42 1096.83 1070.13
R2 1080.42 1080.42 1067.83
R1 1071.83 1071.83 1065.54 1076.13
PP 1055.42 1055.42 1055.42 1057.56
S1 1046.83 1046.83 1060.96 1051.13
S2 1030.42 1030.42 1058.67
S3 1005.42 1021.83 1056.38
S4 980.42 996.83 1049.50 ...by the way ...interesting pivots from Demark today (which can be found on the daily notes page , for newbies, here at mypivots).. i love his high pivot!
that 57 - 58 is top dog for me......I'm looking for shorts until it cleans up.....it seems that some will key off the volume surges, meaning they will try to run it 10 points form their entry..( just testing this concept now) so no surprise the 47 - 48 surge, the 57 - 58 surge so next up top will be the 67 - 68 zone...so close in the overnight...we'll see going forward how this concept pans out......thabks for the numbers guys ..and the charts
second time on the 67's now for me....62 retest I hope....
still looking for 1071 - 73 ....
longer duration profile shows a minimum around the 1069.00 level...
longer duration profile shows a minimum around the 1069.00 level...
it poked its head up above 69 for a few seconds ... am also waiting for 71-72 area to see how price acts when it gets there ... could be a decent short, we'll see ... if comes down instead, will have to re-tool my thinking
I am having some data issue's with both of my providers I am showing a gap in my over night, would some one please quote my hi/lo of the over night and which one came first? thanks in advance!
Joe, I've got overnight hi of 69.50 (7:30am CT) and low of 53.50 (7:53am CT) in that order on ES after jobs report hit.
thx
quote:
Originally posted by BruceM
hey Blue, can IB make vwap bands now or are those bollinger on you chart...? I haven't messed with it lately...thanks
Bruce
Yes the chart is from IB.
The red bars are volume bars by price. I didn't realize they had it.
Your references to volume areas twigged me to look.
the bands are ETB
which I think stands for envelope trading bands.
I wanted something that didn't increase in distance (width) with volatility as Bollinger and, to a lessor extend, Keltner do.
Emini Day Trading /
Daily Notes /
Forecast /
Economic Events /
Search /
Terms and Conditions /
Disclaimer /
Books /
Online Books /
Site Map /
Contact /
Privacy Policy /
Links /
About /
Day Trading Forum /
Investment Calculators /
Pivot Point Calculator /
Market Profile Generator /
Fibonacci Calculator /
Mailing List /
Advertise Here /
Articles /
Financial Terms /
Brokers /
Software /
Holidays /
Stock Split Calendar /
Mortgage Calculator /
Donate
Copyright © 2004-2023, MyPivots. All rights reserved.
Copyright © 2004-2023, MyPivots. All rights reserved.
