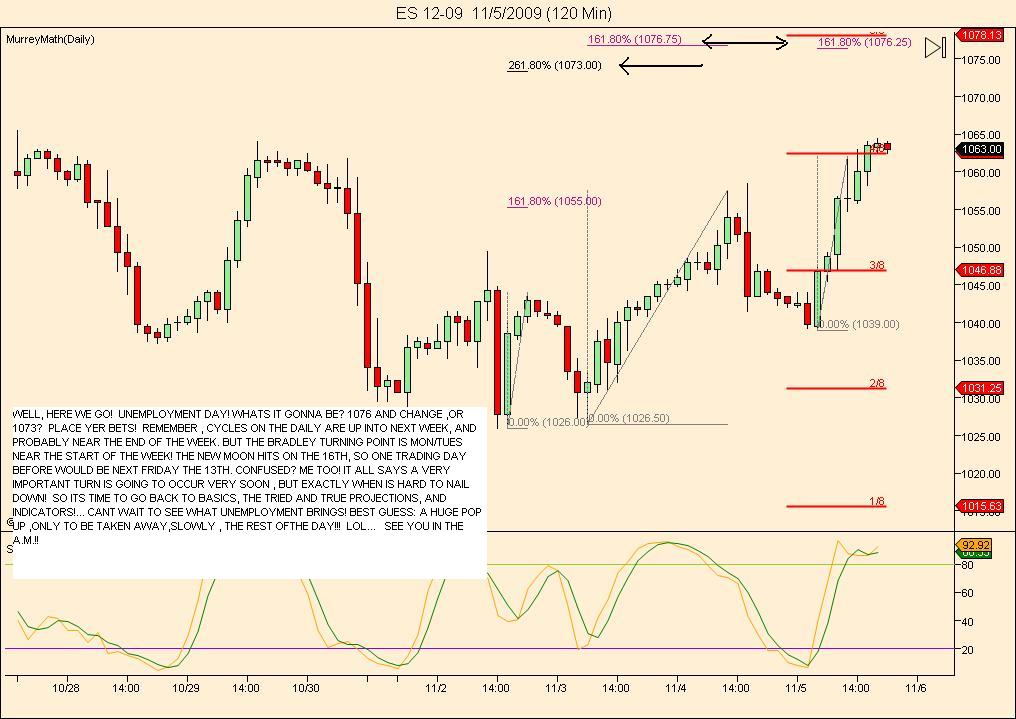
ES 11-05-09 RE CAP
Closing ticks over 1100!!! Indicating a big decline due to start within 2 trading sessions? That means between now and the end of monday!!! Right in the middle of the Bradley turn dates!!!
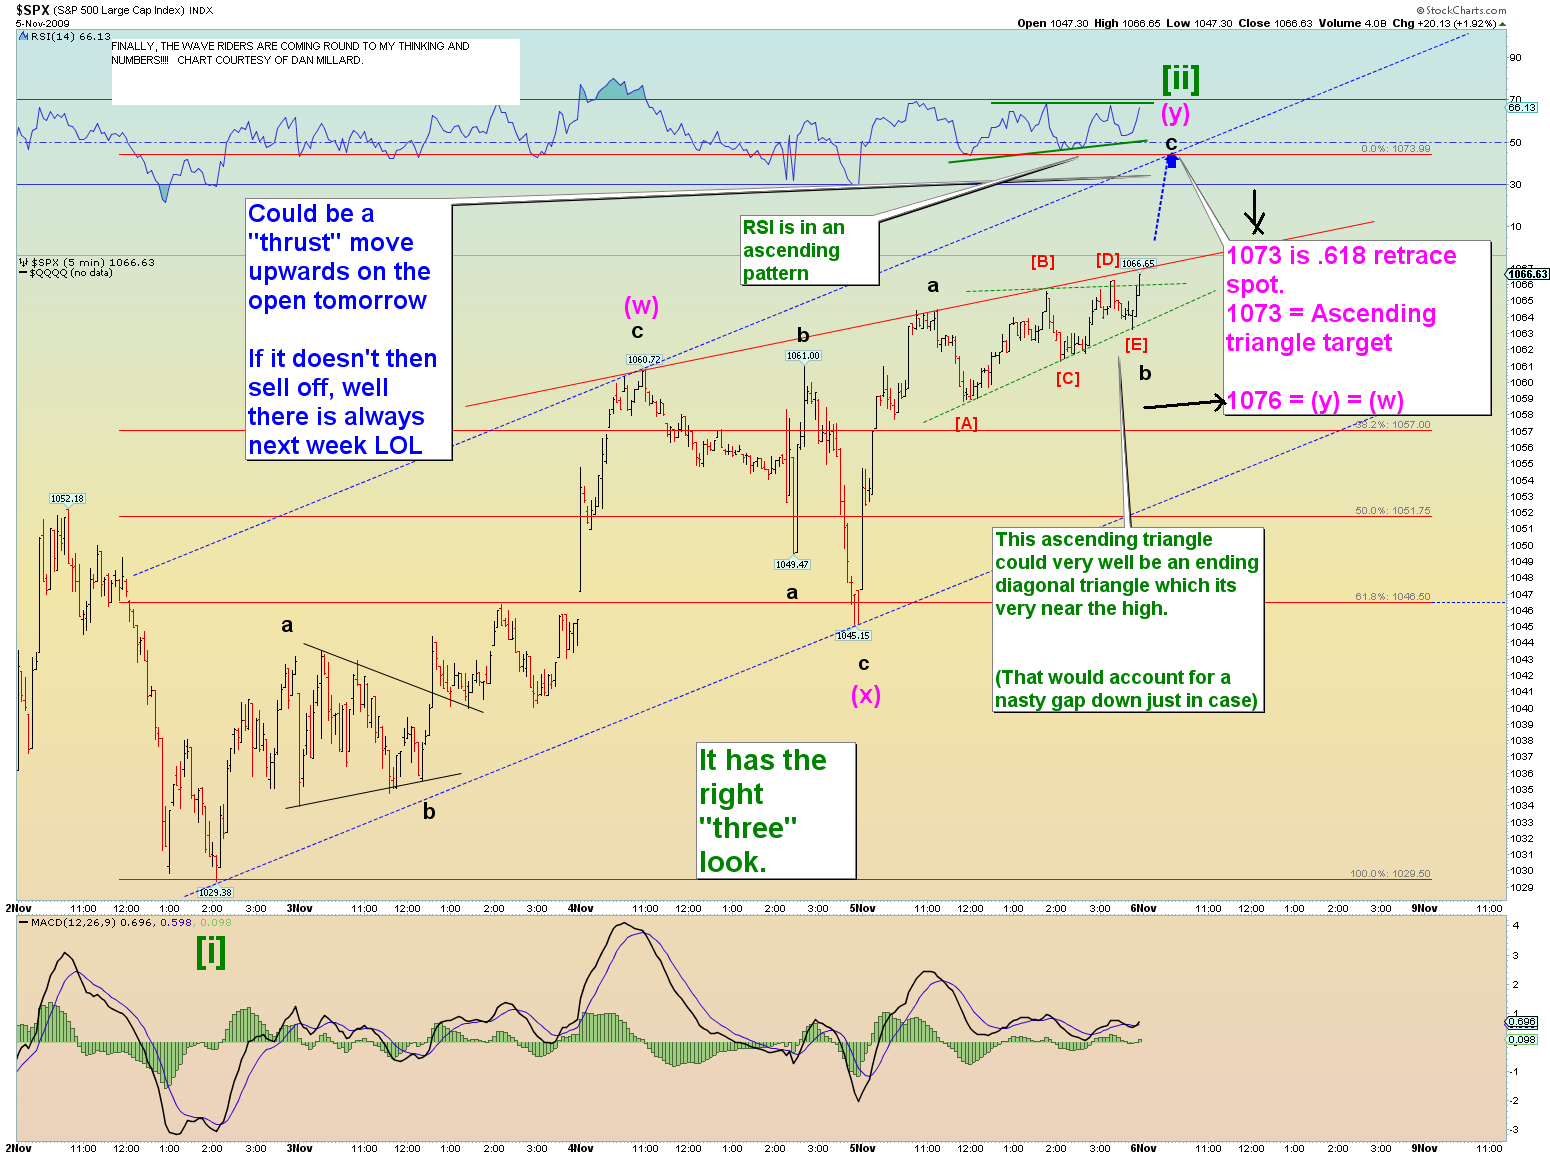
FINALLY THE WAVE RIDERS ARE COMING ROUND TO MY THINKING AND NUMBERS! CHART COURTESY OF DAN MILLARD.
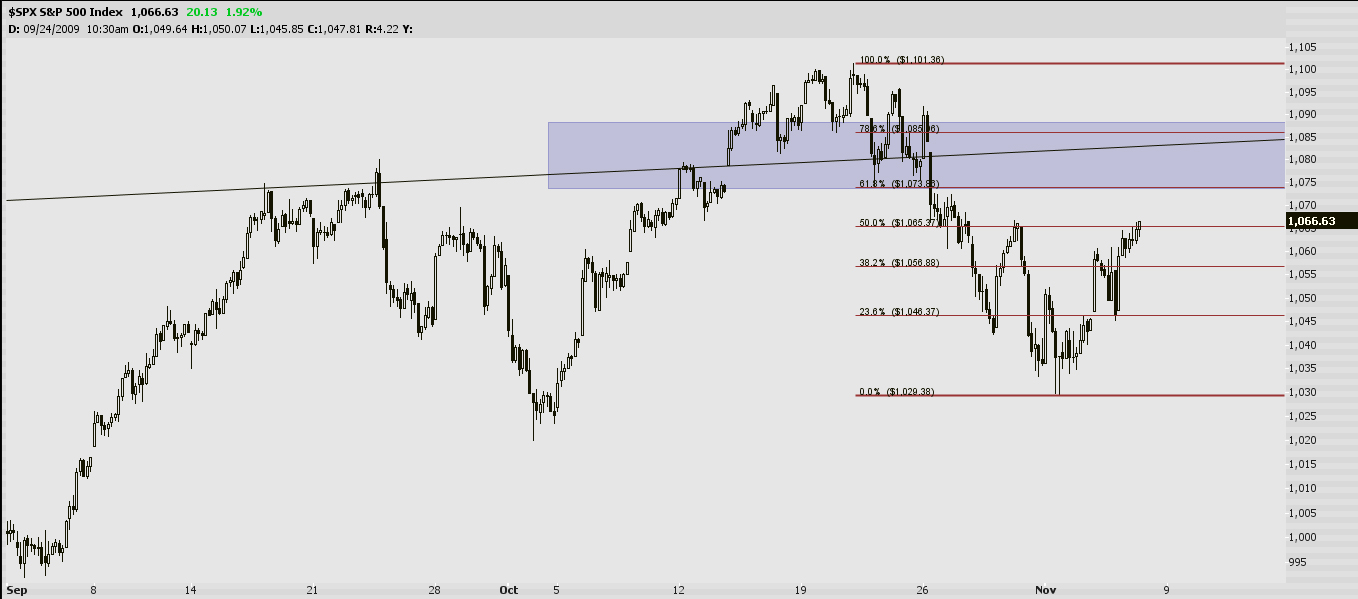
Here is what I am looking at, that trend line is an oldie but a goodie and I think it might just get tested again.
Kool, could you explain your closing tick analysis?
Kool, could you explain your closing tick analysis?
FOR ABOUT A YEAR AND A HALF ,DOSEONE , WHEN EVER CLOSING TICKS O/N THE NYSE GOT TO PLUS 800-1000, THERE WAS A DECLINE OF AT LEAST 40-70 HANDLES WHICH STARTED WITHIN 2 TRADING SESSIONS! OF COURSE THAT WAS DURING THE VICIUOS BEAR DECLINE OF 2008! IT HASNT WORKED AS WELL THE LAST COUPLE OF MONTHS, BUT IS STILL A GOOD WARNING SIGNAL. LAST COUPLE OF MONTHS THE DECLINE PROBABLY AVERAGED MORE LIKE 20 HANDLES...BARELY NOTICEABLE. I SHOULD POINT OUT THO THAT MIGHT BE CHANGING AGAIN! FOR INSTANCE THE LAST 60 PLUS HANDLE DECLINE (LATE SEPT ,EARLY OCT) DOWN TO 1026 WAS SIGNALED BY HIGH CLOSING TICKS!..SO WAS THE ONE OFF OF 956 BACK IN JUNE. ITS REALLY JUST A MEASURE OF OVERBOUGHT ENTHUSIASM I SUPPOSE.
Emini Day Trading /
Daily Notes /
Forecast /
Economic Events /
Search /
Terms and Conditions /
Disclaimer /
Books /
Online Books /
Site Map /
Contact /
Privacy Policy /
Links /
About /
Day Trading Forum /
Investment Calculators /
Pivot Point Calculator /
Market Profile Generator /
Fibonacci Calculator /
Mailing List /
Advertise Here /
Articles /
Financial Terms /
Brokers /
Software /
Holidays /
Stock Split Calendar /
Mortgage Calculator /
Donate
Copyright © 2004-2023, MyPivots. All rights reserved.
Copyright © 2004-2023, MyPivots. All rights reserved.


