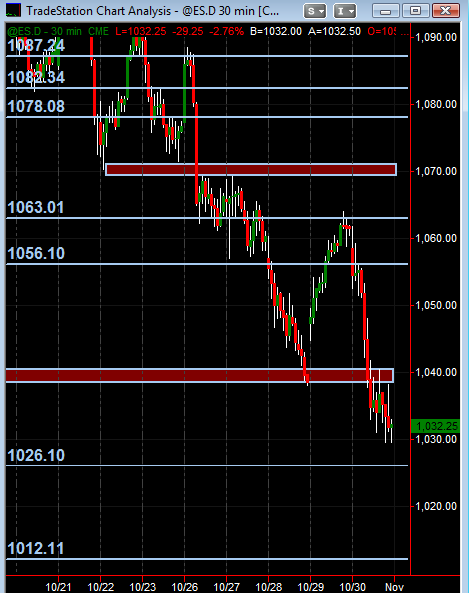
Monkey S/R Levels for 11/2/09
These price levels are what I've got based on multi-time frame S/R price action levels (drawn in on a 30min chart). Not as solid or comfortable with these as usual. But still will be my map along with Pivot Levels from this site in the background.
Open to any feedback and additionally, any and all analysis and chart postings from everyone!!
Open to any feedback and additionally, any and all analysis and chart postings from everyone!!
I still like that 41 area, the 34 area again and now that 27.50 ....all attracted some cool thrusts today so we know somebody with more than us played against them...seems like we'll need to fill in the profile between the 34 and 41 some more.....overnight we'll confirm or negate the thrusts generated from todays trading
Hey Bruce, just curious, do you ever look at the merged profiles any more? Man i used to love those weekly and monthly charts!
no Kool...I also found them enjoyable but the challenge for me with those was always trying to remove the discretion from choosing the "correct" time period to look back. I have found that certain legs of market moves will attract high vertical volume at the same approximate price levels even on different days so price eventually spends more time there and that in theroy can pinpoint the same longer term profile volume point.....the 1061 area comes to mind.....that is long answer of "no I donot"
Emini Day Trading /
Daily Notes /
Forecast /
Economic Events /
Search /
Terms and Conditions /
Disclaimer /
Books /
Online Books /
Site Map /
Contact /
Privacy Policy /
Links /
About /
Day Trading Forum /
Investment Calculators /
Pivot Point Calculator /
Market Profile Generator /
Fibonacci Calculator /
Mailing List /
Advertise Here /
Articles /
Financial Terms /
Brokers /
Software /
Holidays /
Stock Split Calendar /
Mortgage Calculator /
Donate
Copyright © 2004-2023, MyPivots. All rights reserved.
Copyright © 2004-2023, MyPivots. All rights reserved.
