Center of Gravity bands
This is a 30min chart of the S&P 500. The thicker bands are longer term and the smaller bands are shorter term bands. Hurst made these bands popular and he had a 400 hour home course on how to do them by hand. I used to do them by hand on the 30min and they worked great as you can see. The only problem was that it took a great amount of time to figure the bands by hand and only daily and weekly work because I need to concentrate on the markets and not charts.
When the bands are trending up use the set of green parallel lines on the RSI as overbought/oversold lines. When the Market is trending down use the red as overbought/oversold.
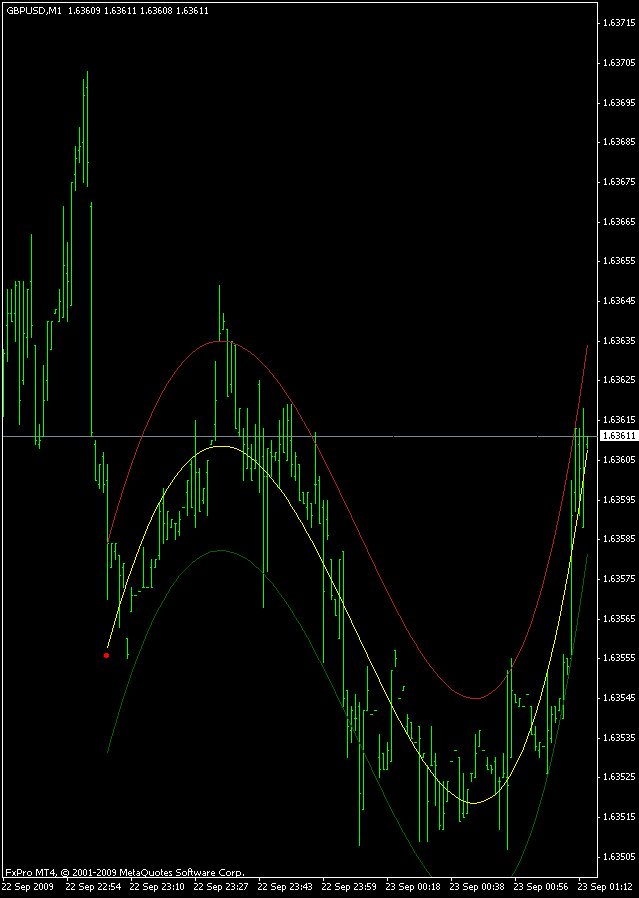
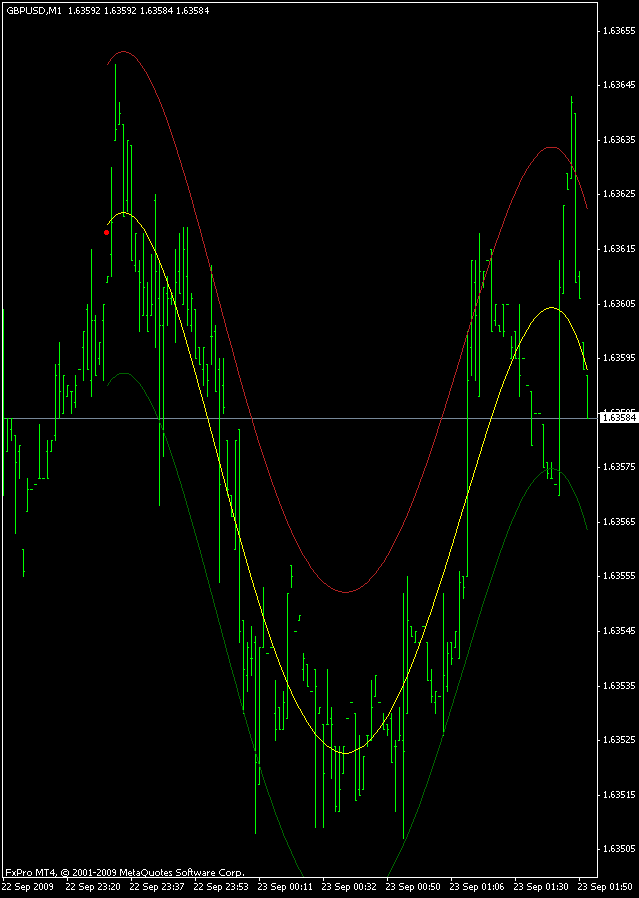
These bands are awesome in the Forex markets All you do is line up fast and slow on the 1 min, 5, 15 or any combo of 3 TF's.
GBP/USD 1 min
EUR/USD 1 min
The only problem this is coded in only metatrader at the moment who is a FX broker. And I don't think I'll ever go back to scalping the ES, NQ I have been bitten bad by the COGFX bug.
WHats the set up for a trade with these bands? Wheres the entry and exit?
quote:
Originally posted by rainman99
WHats the set up for a trade with these bands? Wheres the entry and exit?
Support above resistance below. In the FX markets you want to make sure you are not shorting in a bull move, unless its a smaller than normal amount. Right now I am scalping and am looking for the 1min slow, and fast bands to be pointing in the same direction as well as slow and fast bands in the 5min or 15min. buy pullbacks to the red band (bands pointing up) in an uptrend and short pullbacks to the green band in a downtrend (bands pointing down)
quote:
Originally posted by rainman99
Cool, Thanks. Is this your first time at trading Forex? Forex is one market I have never traded.
Up until the last month I have never traded FX. I have traded the Euro futures and the yen quite a bit. I am now in FX because the spreads are much better, I can make as many entries exits as I wish because the commissions are paid by the spread. Also there are other motives that drive the currency markets that are not so in the ES. If dell needs to pay its workers in Tokyo from $200 million from the computers it just sold in the US from kids going back to school the could care less that the USD/JPY is at a low or it just broke its 200MA, or the usd is fundamental weak...Dell couldn't care less they just want to sell computers make a buck and pay its workers, so they dump it all at once which cause a free fall for a few min, where as in the ES they may spread it over a few hours to a few days.
Think of COG as a bell curve the majority of the trading in any unit wither it be the ES, YM, corn, aapl, EUR/USD it will trade the majority of the time at the center of the bands. It will trade the least amount of time at the extream ends and it will break through even less often. This is why in an up trending market it will often violently bounce off the lower band.
So if commissions are paid by the spread are the spreads wide? Or are they as tight as the ES?
quote:
Originally posted by CharterJoe
Think of COG as a bell curve the majority of the trading in any unit wither it be the ES, YM, corn, aapl, EUR/USD it will trade the majority of the time at the center of the bands. It will trade the least amount of time at the extream ends and it will break through even less often. This is why in an up trending market it will often violently bounce off the lower band.
Thank you CharterJoe;
may I ask a favor;
will you please plot on the same chart
1)a Keltner channel(bars=28, width=3)
and
2) another Keltner channel(bars=28, width=3.5)
just to compare it to the cog bands;
As I understand the cog bands have nothing to do with the Ehlers cog oscillator;
basically they are a polynomial regression plus a width offset. (ATR multiple I think)
I don't have the code for the bands, but as I read in forums, the polynomial curve fit changes all the time and so do the bands;
In that respect, a Keltner channel (which is not re-calculated, and does not change) may be just as good (who knows, perhaps better?).
Thanks in Advance.
cheers..
Sorry I don't have keltner channels on either forex platform. The problem with keltner is that when it breaks the outer bands it may take 50bars for the keltner to readjust.
These bands are no holy grail they do change but its an indicator based on a predefined # of bars. So if it figures 150 bars when ever a bar changes it will readjust. But we are not talking any giant movements. I think most of the naysayers don't know how to trade. If you would read Hurst's books and courses it is a rather intense method of finding what cycle is on what time frame and adjusting the bands to that given cycle.
The COG bands do not predict the market turns before they happen.
Perhaps you can post a couple charts of the S&P 500 say 30min and I'll do the same and you can compare them that way?
quote:
Originally posted by CharterJoe
Sorry I don't have keltner channels on either forex platform.
easy to find;
there you go
//+------------------------------------------------------------------+
//| Keltner Channels.mq4 |
//| Coded by Gilani |
//| Copyright © 2005, MetaQuotes Software Corp. |
//| http://www.metaquotes.net |
//+------------------------------------------------------------------+
#property copyright "Copyright © 2005, MetaQuotes Software Corp."
#property link "http://www.metaquotes.net"
//+------------------------------------------------------------------+
//| Custom indicator initialization function |
//+------------------------------------------------------------------+
#property indicator_chart_window
#property indicator_buffers 3
#property indicator_color1 White
#property indicator_color2 White
#property indicator_color3 White
double upper[], middle[], lower[];
extern int period = 10;
int init()
{
SetIndexStyle(0,DRAW_LINE);
SetIndexShift(0,0);
SetIndexDrawBegin(0,0);
SetIndexBuffer(0,upper);
SetIndexStyle(1,DRAW_LINE);
SetIndexShift(1,0);
SetIndexDrawBegin(1,0);
SetIndexBuffer(1,middle);
SetIndexStyle(2,DRAW_LINE);
SetIndexShift(2,0);
SetIndexDrawBegin(2,0);
SetIndexBuffer(2,lower);
return(0);
}
int deinit(){return(0);}
int start() {
int limit;
int counted_bars=IndicatorCounted();
if(counted_bars<0) return(-1);
if(counted_bars>0) counted_bars--;
limit=Bars-counted_bars;
double avg;
for(int x=0; x<limit; x++) {
middle[x] = iMA(NULL, 0, period, 0, MODE_SMA, PRICE_CLOSE, x);
avg = findAvg(period, x);
upper[x] = middle[x] + avg;
lower[x] = middle[x] - avg;
}
return(0);
}
//+------------------------------------------------------------------+
double findAvg(int period, int shift) {
double sum=0;
for (int x=shift;x<(shift+period);x++) {
sum += High[x]-Low[x];
}
sum = sum/period;
return (sum);
}
cheers...
anybody still using COG?
Emini Day Trading /
Daily Notes /
Forecast /
Economic Events /
Search /
Terms and Conditions /
Disclaimer /
Books /
Online Books /
Site Map /
Contact /
Privacy Policy /
Links /
About /
Day Trading Forum /
Investment Calculators /
Pivot Point Calculator /
Market Profile Generator /
Fibonacci Calculator /
Mailing List /
Advertise Here /
Articles /
Financial Terms /
Brokers /
Software /
Holidays /
Stock Split Calendar /
Mortgage Calculator /
Donate
Copyright © 2004-2023, MyPivots. All rights reserved.
Copyright © 2004-2023, MyPivots. All rights reserved.


