Weekend charts 7-11-09
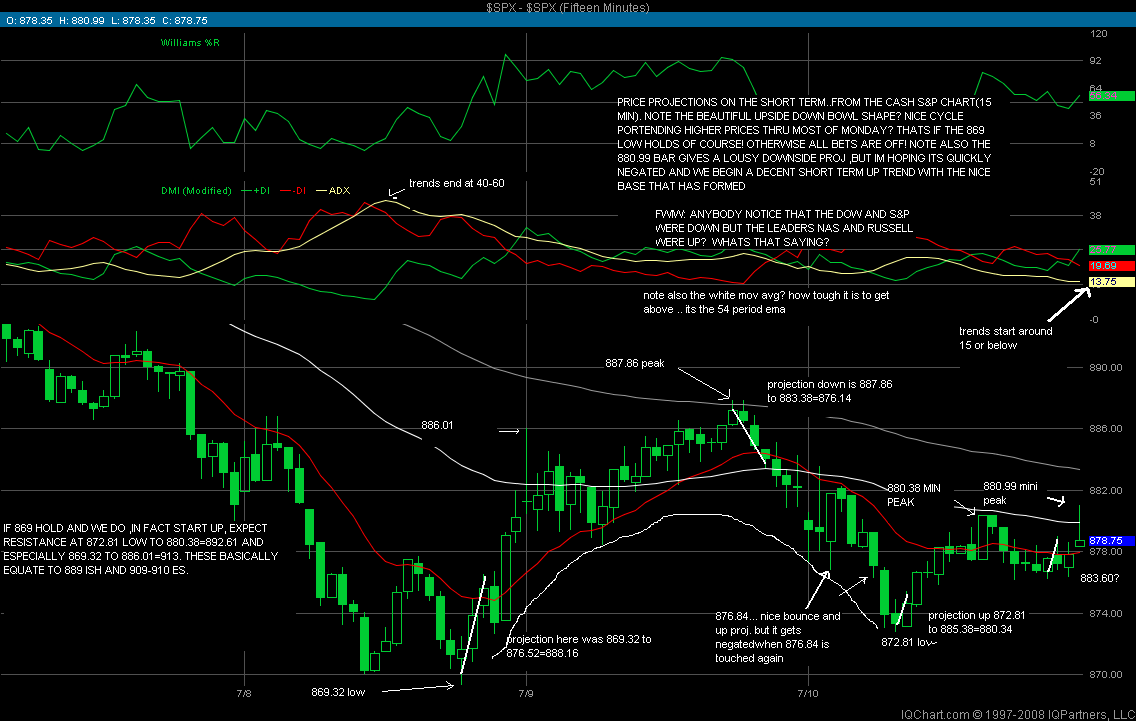
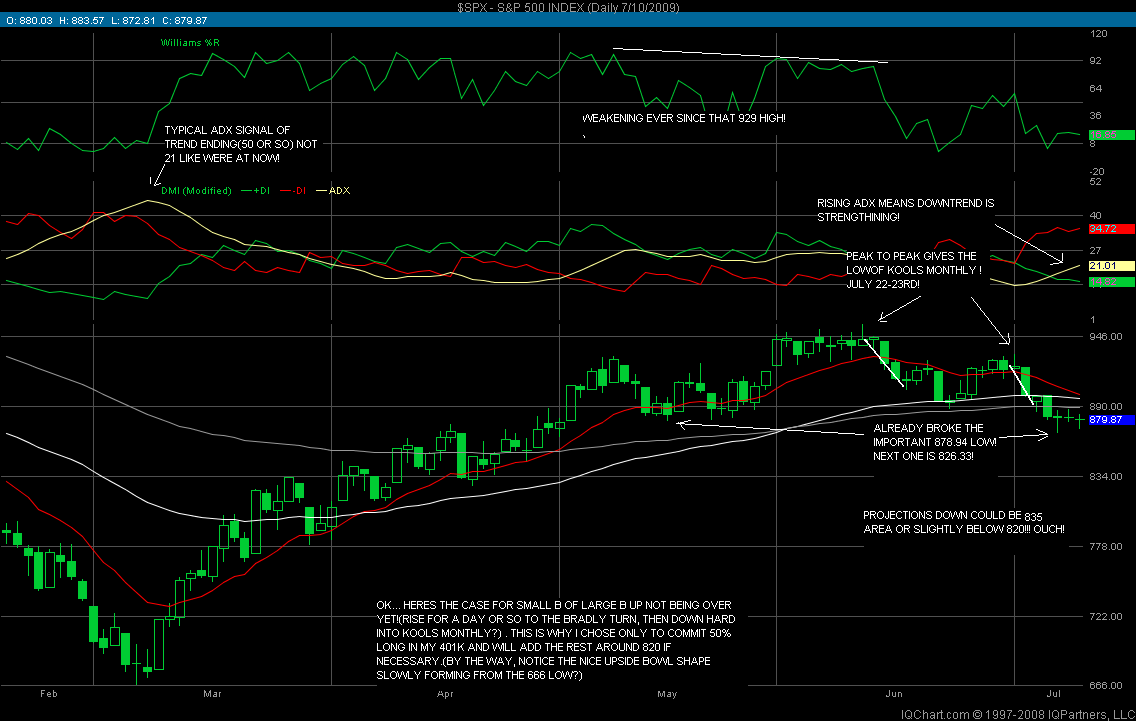
Theres a lot on this chart but study it carefully. It basically shows how i do what i do. I chose the cash chart for fun and to show that Kools Tools work on anything! Best guess longer term is we bounce up into the bradley turning point timeframe posted friday. then decline back into the 21st to 23rd time frame.(The nuance i call Kools monthly! i posted on this 7-09-09!) The alternative is, im completely wrong and we slam down next week early, into the head and shoulders target around 828 or so! Always possible of course. the longer term daily chart sure doesnt look very good! i posted earlier this week to show that(below moving avgs which are about to cross, etc) Either way, the markets are beginning to get fun again! the next 2 weeks should afford some decent action!...
Emini Day Trading /
Daily Notes /
Forecast /
Economic Events /
Search /
Terms and Conditions /
Disclaimer /
Books /
Online Books /
Site Map /
Contact /
Privacy Policy /
Links /
About /
Day Trading Forum /
Investment Calculators /
Pivot Point Calculator /
Market Profile Generator /
Fibonacci Calculator /
Mailing List /
Advertise Here /
Articles /
Financial Terms /
Brokers /
Software /
Holidays /
Stock Split Calendar /
Mortgage Calculator /
Donate
Copyright © 2004-2023, MyPivots. All rights reserved.
Copyright © 2004-2023, MyPivots. All rights reserved.


