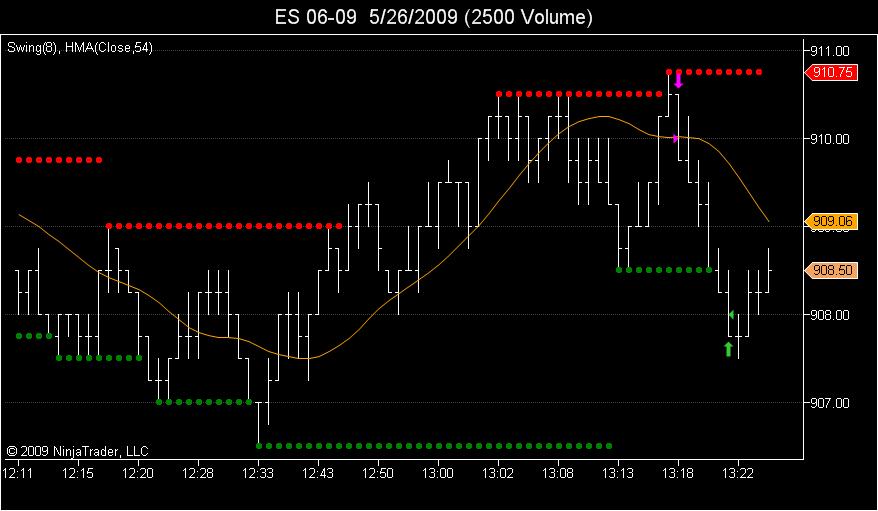
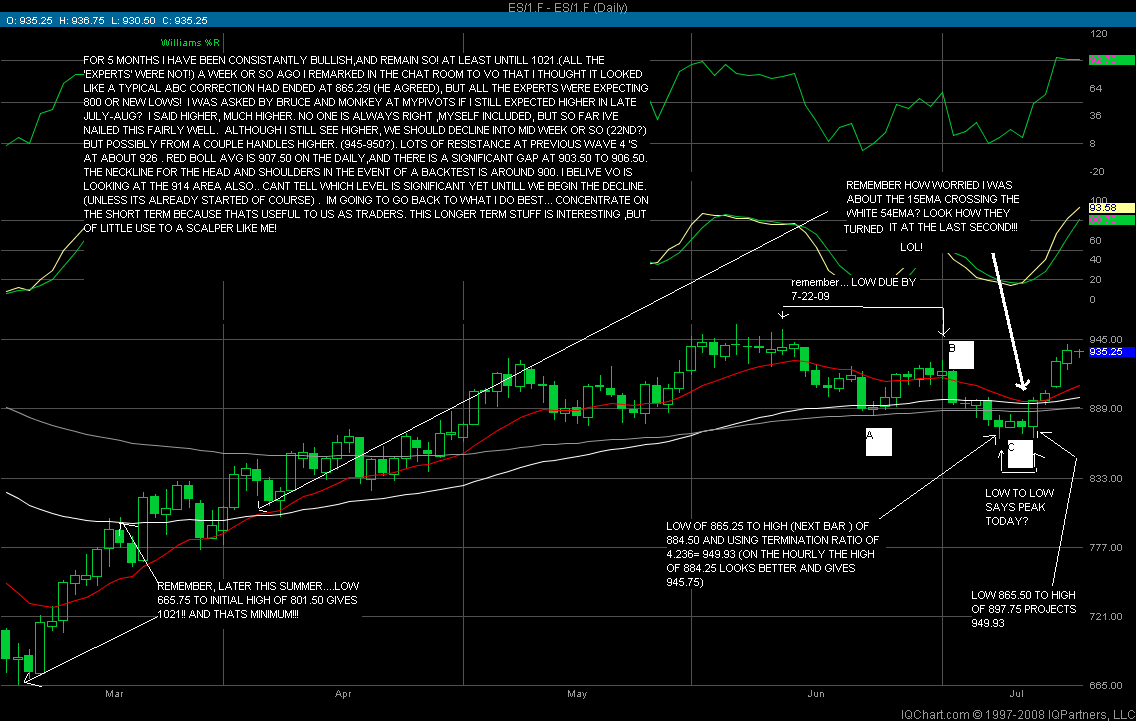
Charts 5-26-09
Lets keep a couple things in mind today. The daily projection down has not been negated and is 847. T he detailed analysis i posted some time ago is still active, ie: watch for a bounce around 870-871. some fun facts to consider. Using kools tools cycles clearly shows a low due by june 4th. because of the higher candle body on 5-8 it could very well end up being the 3rd. The 929.50 to 898.00 candle projects 847.00.using Charter Joes square root theory, the square root of 929.50- (a fib ratio)1.382 and then multiplied by itself =...847! If a(or 1)is 923.50 to 877.75 , then c(or 3)= 1.618 x a at 850.25. if wave a is 929.50 to 875.25, then up to 923.50 would be wave b.c= 1.382xa at 848.50. using H.W. Steeles work, the low 662.75 to the 929.50 top = 266.75 . moving a decimal to the left one place gives 26.675 calendar days(he would round to 27) from the 929.50 top.on 5-7-09. and this gives June 3rd as a turning point!
Emini Day Trading /
Daily Notes /
Forecast /
Economic Events /
Search /
Terms and Conditions /
Disclaimer /
Books /
Online Books /
Site Map /
Contact /
Privacy Policy /
Links /
About /
Day Trading Forum /
Investment Calculators /
Pivot Point Calculator /
Market Profile Generator /
Fibonacci Calculator /
Mailing List /
Advertise Here /
Articles /
Financial Terms /
Brokers /
Software /
Holidays /
Stock Split Calendar /
Mortgage Calculator /
Donate
Copyright © 2004-2023, MyPivots. All rights reserved.
Copyright © 2004-2023, MyPivots. All rights reserved.


