MTP applied with Ninjatrader and TTT
Hi everyone, I was asked on the Ninjatrader support forum to show how I was using MTPredictor with Ninjatrader and TTT method.
I will show just a few examples on this forum as it is easier for me that way, of course I won't show all the indicators I use with these signals as I have spent so many hours researching that I don't feel like giving them away.
So I will start with the TF Thursday May 14th. First from Richard's TTT e-mail I had this:
to start with Today was a Sell day(Wednesday). We didn't get much of a rally. ES and YM gapped down below the Buy day low and did rally to these lows, while TF and NQ opened above the Buy day low and dropped never looking back. TVGR was in effect all day.
Tomorrow (Thursday)is SS day. We do have 85% chance of getting at least back to the Buy day lows.
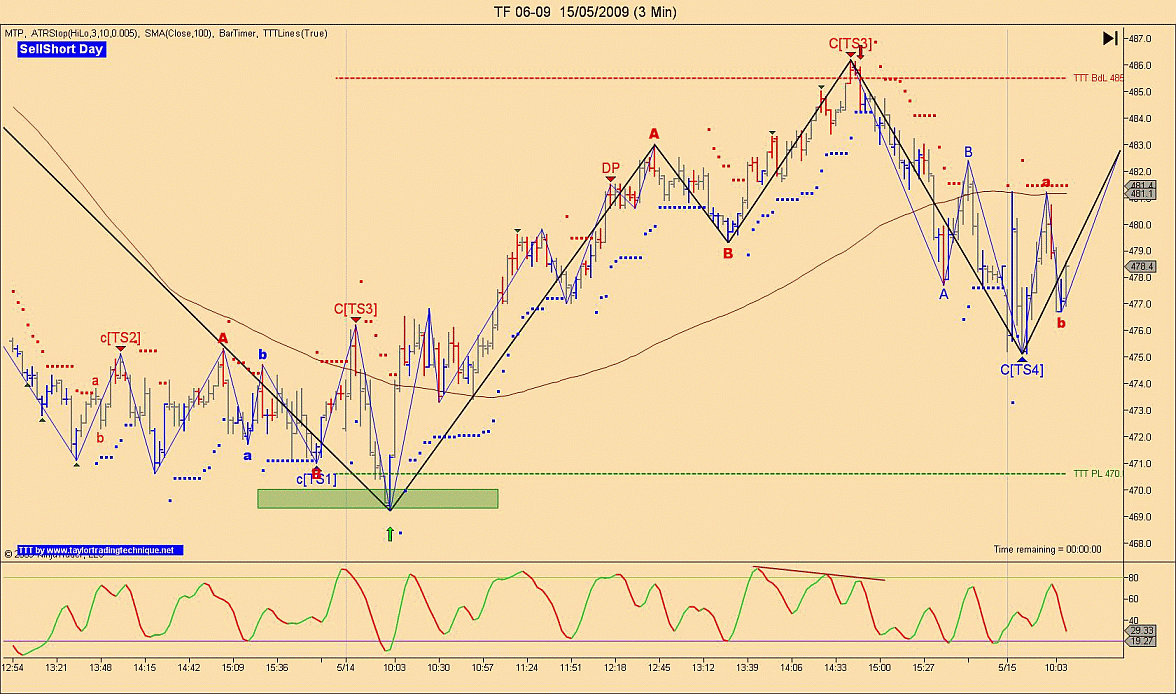
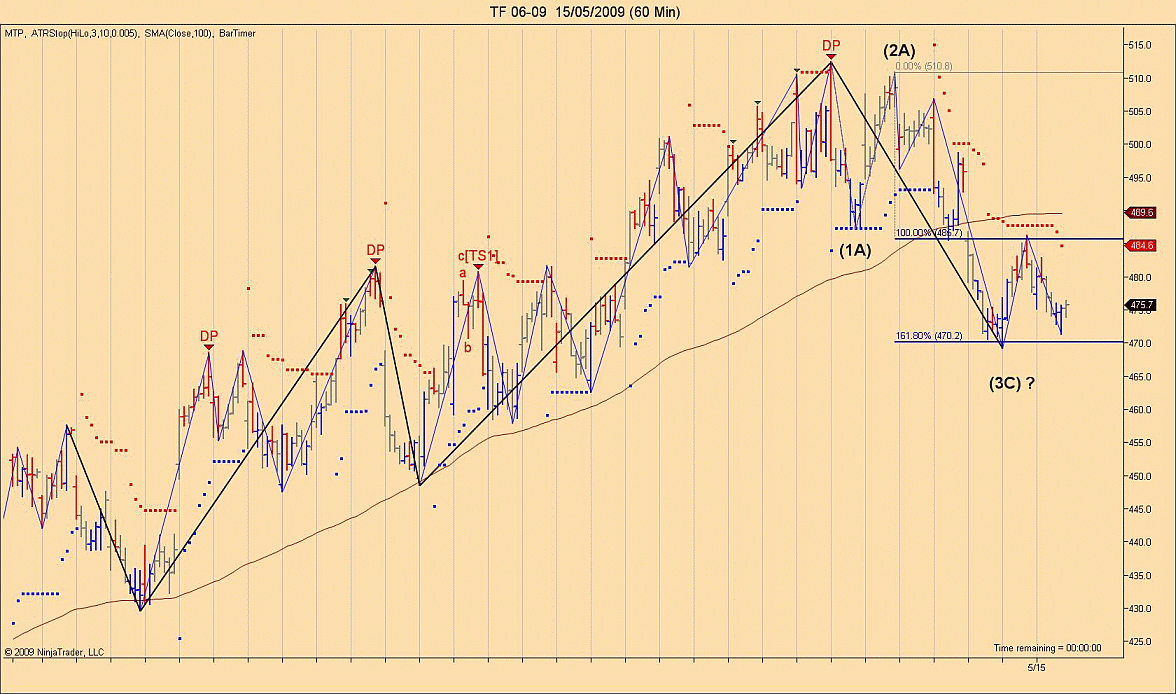
So from the opening TF opened at a manual DP level, based on the odds of going back to the buy day low I was a buyer at this level you could say takes some guts to do that but what about if we look at the 60 min chart and see that we are also at the 162% extension level from wave 1 and 2, hum this makes it much more interesting don't you think.
Then around 14:30 we reached the buy day low so it was now time to sell TF as we also had stochastic divergence
quote:
Originally posted by jcflaw
I would have thought today would be a down day (DP on your chart) and was surprised by the strength. Did MTP or TTT keep you on the right side?
Hi John from Friday's TTT e-mail: Hi All
Today was a Buy day. As expected we did get our decline.
Monday will be a Sell day. We should get a rally from today's lows. We finished 5 waves down today so a correction up would match TTT rally.
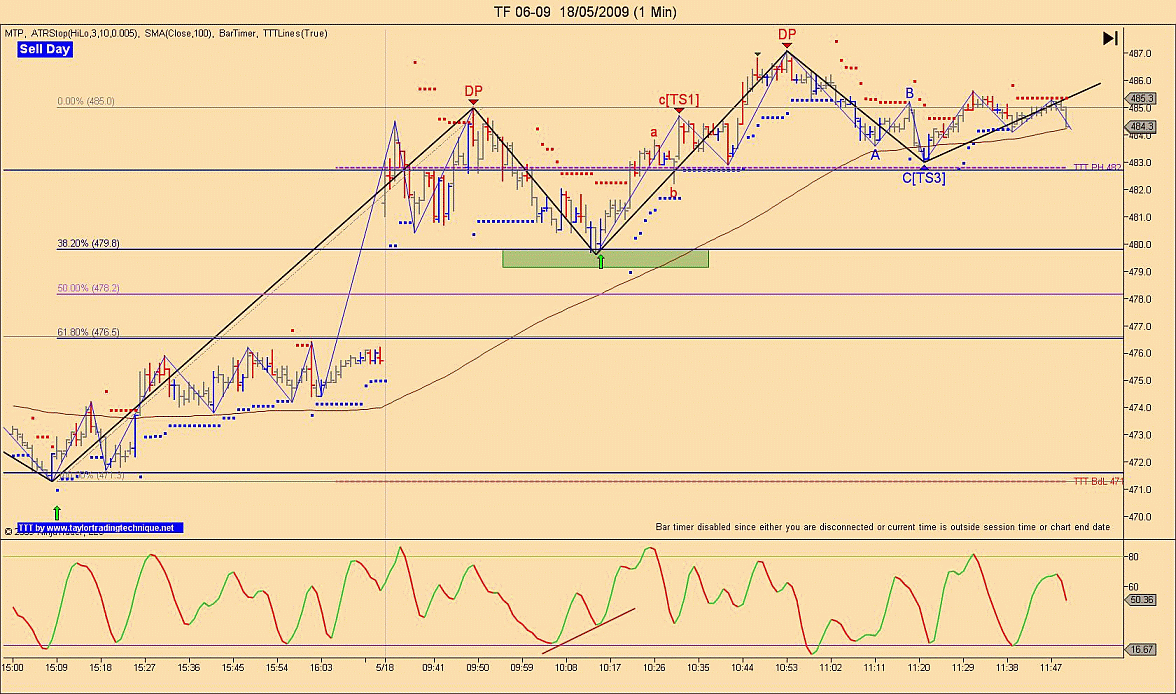
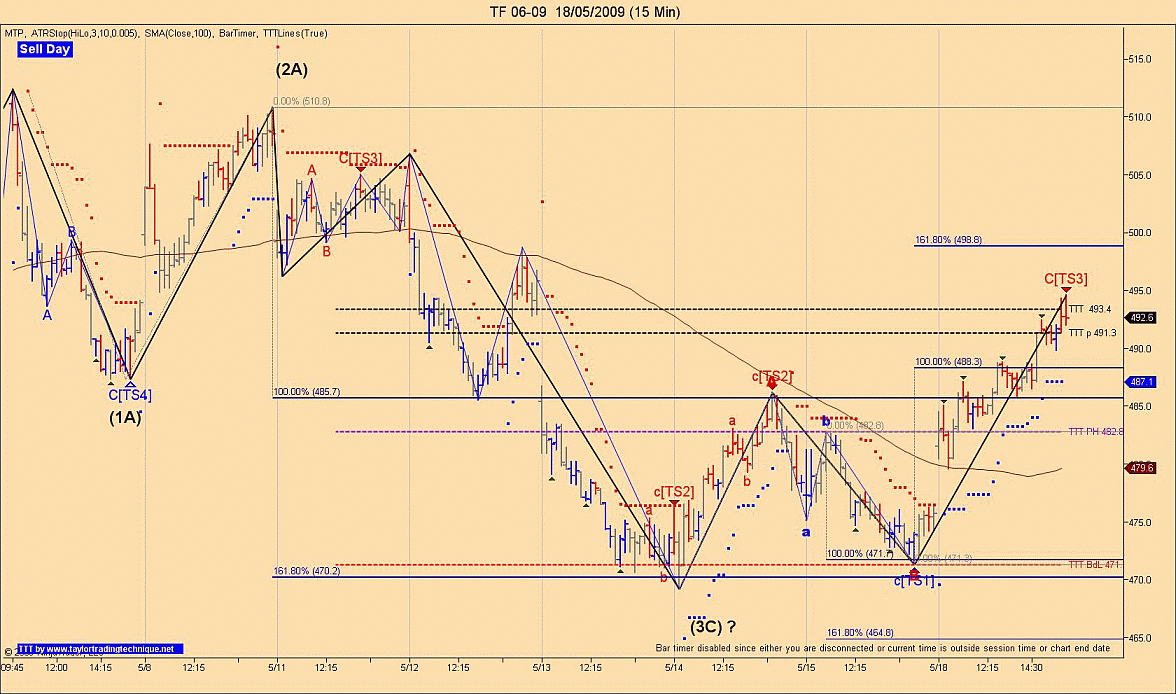
So based on this and the fact that ES had reached a possible 5 waves decline on a daily chart a move up was to be expected. If we look at TF daily chart it was different as we only had 3 waves down so from Friday's pattern I was expecting at minimum 488.3 on the 15 min chart and TTT levels were higher so any short before these targets were risky. Instead your best bet was to buy any good pull back retracements from the opening like the one on the 1 min chart as we had a manual DP and a 38% retrace at478.9 with stochastic divergence. Let's not forget today was a gap up day so TVGR was in all day so when you have this it just means don't fight the trend
I hope this help you understand what was my game plan today.
How do you get the Blue sell day box moved to left of chart.
quote:
Originally posted by garciaal
How do you get the Blue sell day box moved to left of chart.
The latest version is set that way
The latest was sent a while back. If you dont have it email me
So, Larry, you seem to like the TF. Do you look at Daily, 60,15,5,3,1m using MTP to see which time period has the best EW sequence?
BTW, How do you get daily charts with Ninja - I can't seem to get it.
John I look at both TF and ES it's easy for me as I have 4 monitors 22 inches each and for the next question I have the E-Mini package with E-Signal so I don't know where you grab your data feed from as most of them provide daily charts.
I am going to get the MTP program. I tried Advanced Get years ago but I found it to be too complex. MTP seems to be focused and not as complex at least from a review of the blog. Of course, TTT too though I have a complex fibonacci program I like the logic behind TTT lines and the fact that it gives a bias for the trading day.
Apparently, Zen Fire doesn't have daily data for charting on NT so I may have to work off of 60m as my big picture Timeframe.
Thanks for info
Apparently, Zen Fire doesn't have daily data for charting on NT so I may have to work off of 60m as my big picture Timeframe.
Thanks for info
jcflaw, you could use a 405min bar for one day, if Zen will let you do that
or 1440 for the 24hr session if it works I dont know with zenfire
Larry, on TVGR days do you use the 1 minute for entry rather than 3/5 minute?
Originally posted by jcflaw
Hey, it has been long time...have you discovered any secondary indicators that work well with MTP?
Still trading divergence with EW?
John
Hi John, yes I have discovered nice indicators to help me out in my trading but they are not mine so I can't share any of them, sorry about that.
Emini Day Trading /
Daily Notes /
Forecast /
Economic Events /
Search /
Terms and Conditions /
Disclaimer /
Books /
Online Books /
Site Map /
Contact /
Privacy Policy /
Links /
About /
Day Trading Forum /
Investment Calculators /
Pivot Point Calculator /
Market Profile Generator /
Fibonacci Calculator /
Mailing List /
Advertise Here /
Articles /
Financial Terms /
Brokers /
Software /
Holidays /
Stock Split Calendar /
Mortgage Calculator /
Donate
Copyright © 2004-2023, MyPivots. All rights reserved.
Copyright © 2004-2023, MyPivots. All rights reserved.


