ES to 892 area ?
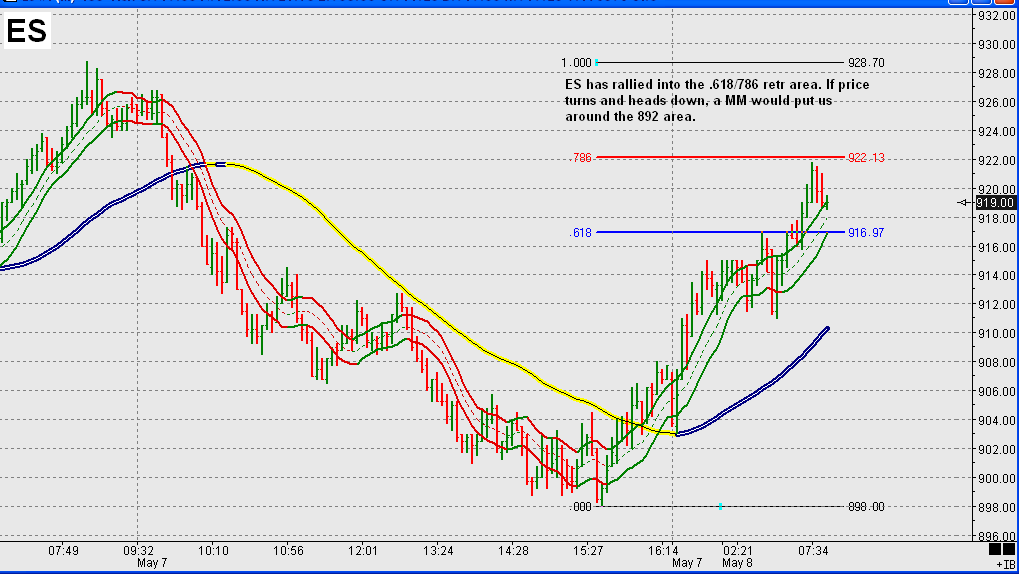
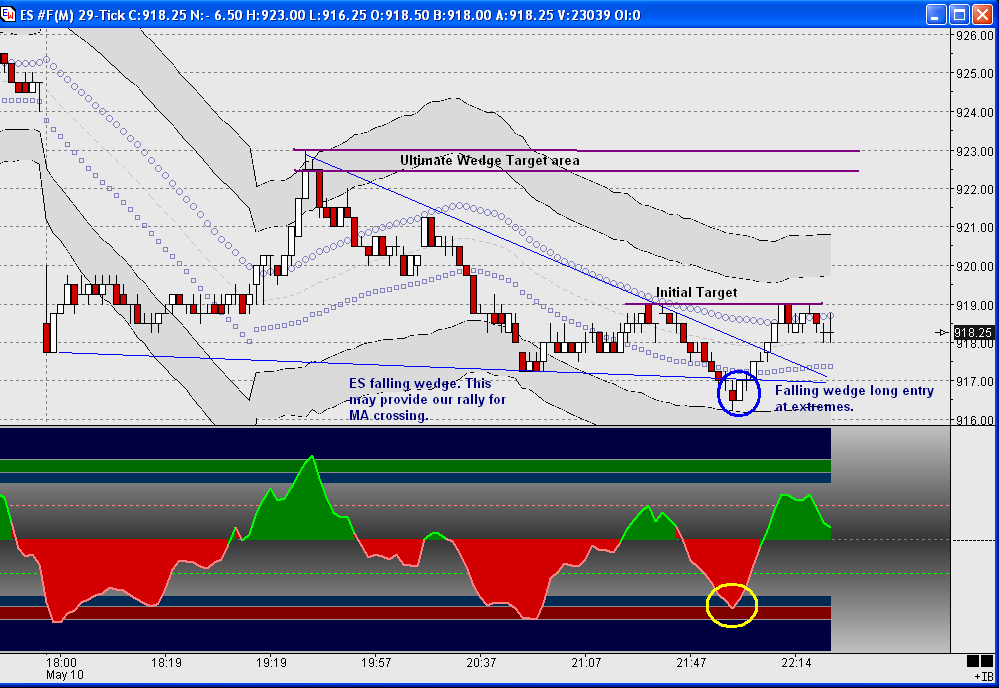
I was trying to post this earlier (as you can see on my chart), but lost power with a storm passing through. I see we've possibly started the move down. Lets see if indeed we are head down to 892 (MM).
Thanks ninja I was looking at 891.75...we'll see
Using the slightly higher high made since my original post, if this is to be a MM down from our recent peak, we are now looking at around 893 vs 892.
Well, the patient isnt dead yet, but he looks worse than he did! lol We'll check in later.
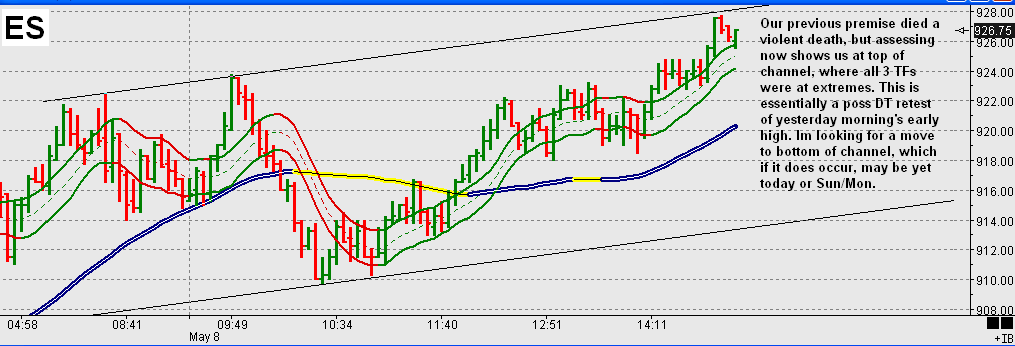
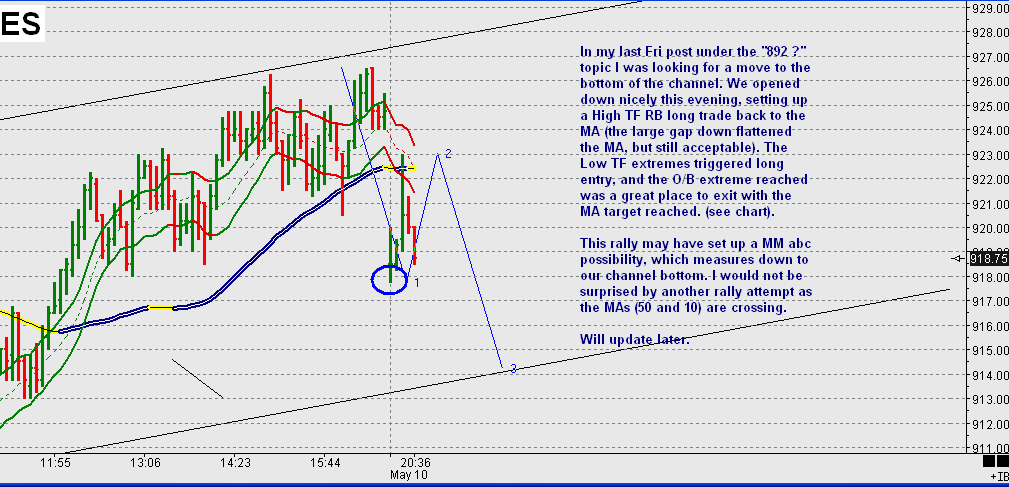
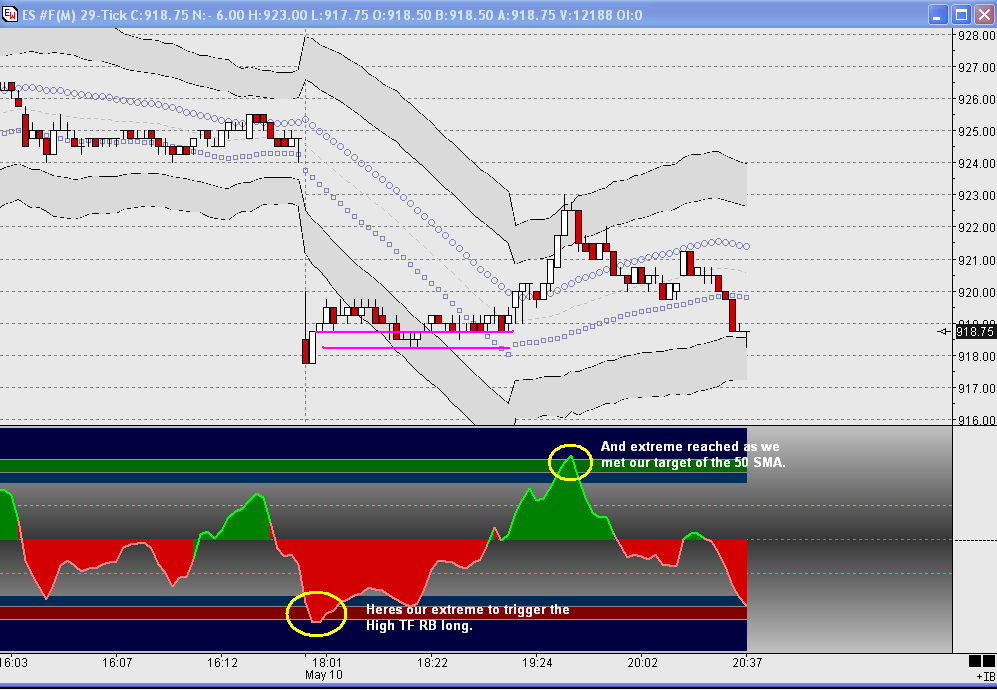
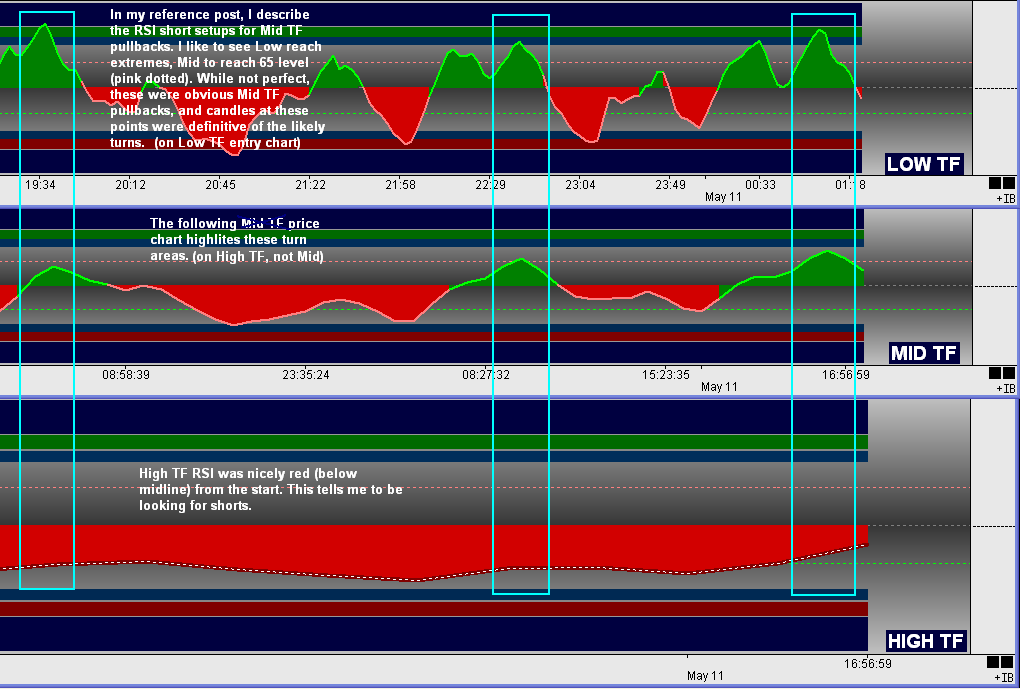
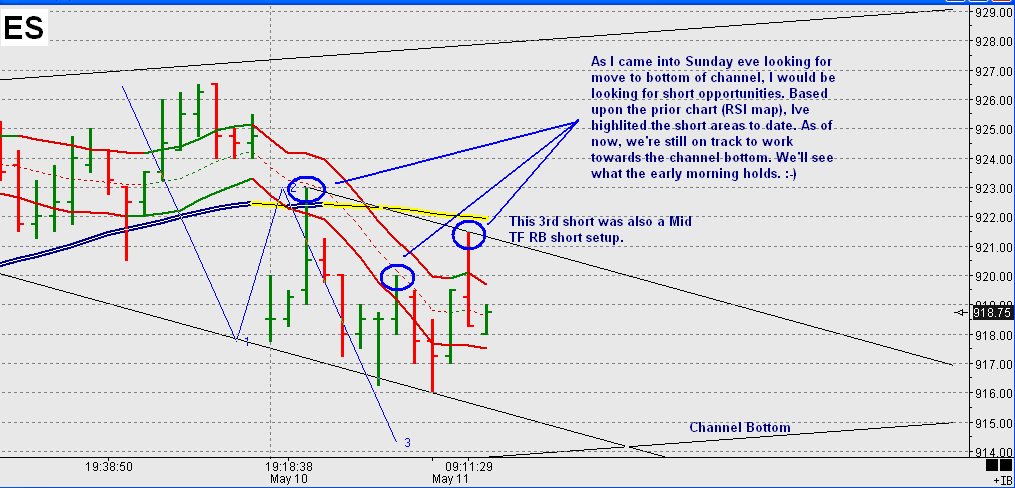
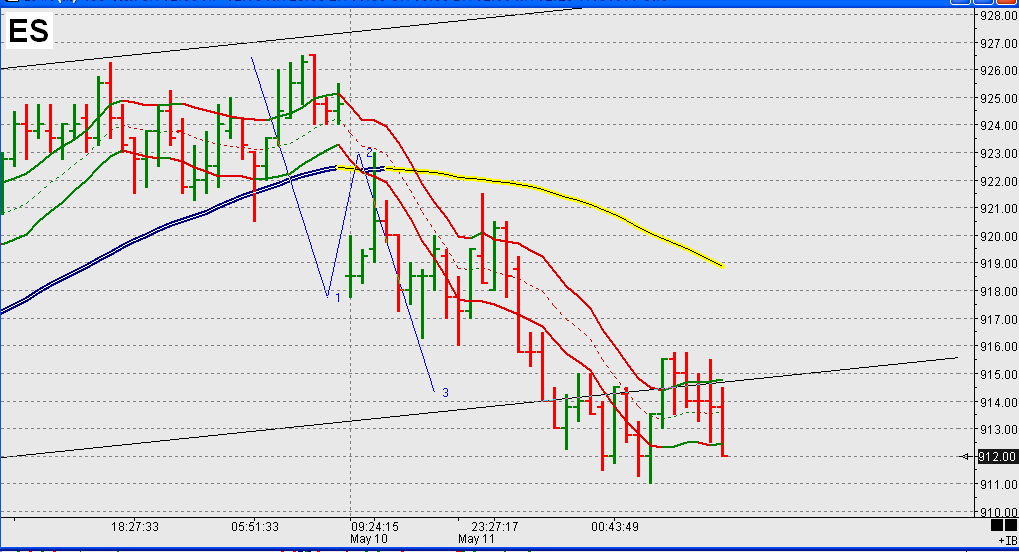
Heres a couple of charts to update our potential channel bottom move Sunday eve/Mon morning. The first is my RSI map chart, followed by my High TF chart.
Emini Day Trading /
Daily Notes /
Forecast /
Economic Events /
Search /
Terms and Conditions /
Disclaimer /
Books /
Online Books /
Site Map /
Contact /
Privacy Policy /
Links /
About /
Day Trading Forum /
Investment Calculators /
Pivot Point Calculator /
Market Profile Generator /
Fibonacci Calculator /
Mailing List /
Advertise Here /
Articles /
Financial Terms /
Brokers /
Software /
Holidays /
Stock Split Calendar /
Mortgage Calculator /
Donate
Copyright © 2004-2023, MyPivots. All rights reserved.
Copyright © 2004-2023, MyPivots. All rights reserved.
