Trading Methodologies Reference
MM and all:
My primary trading focus is that of trading "Turns". To me, this means selling peaks in an "uptrend", and buying troughs in a "downtrend". I use 3 TFs (time frames) to accomplish this.
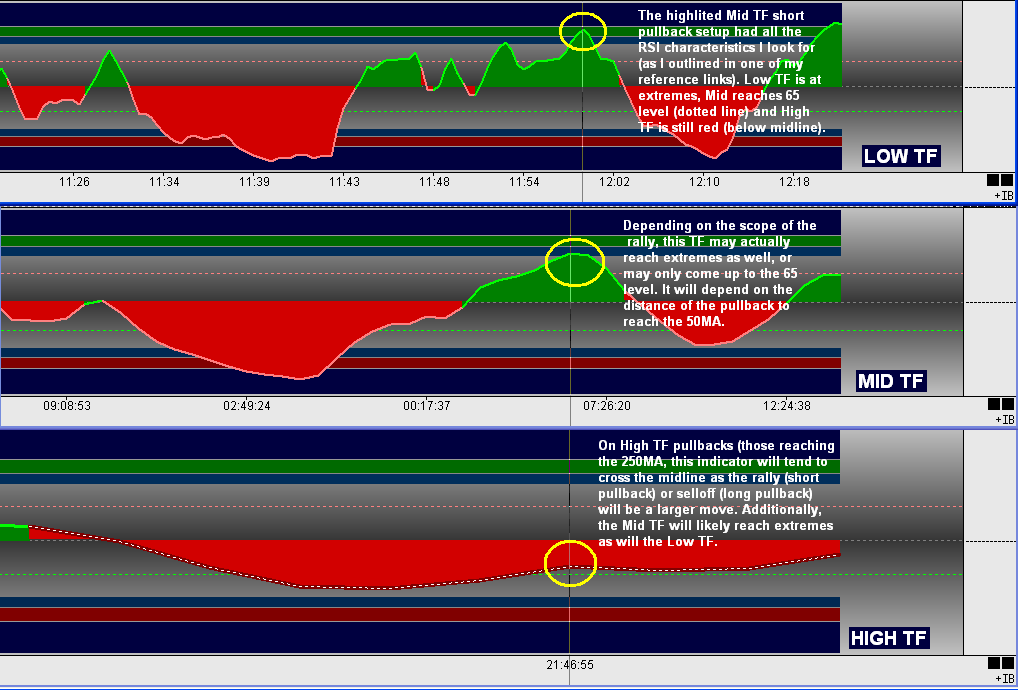
1. Low TF - this is where I determine my entry. This TF will virtually always be at extremes when short/long entry is made (or divergent from prior extreme)on RSI chart.
2. Mid TF - this is a muliple of 3 higher than Low (if Low is 29tick, Mid will be 87tick). I monitor this TF for wedges, channels, sup/res within a working "trend" in order to find Turn setups. These tools tend to have "targets" associated with them, and thats why I use them. I also rely heavily on the RSI chart to monitor extremes being reached.
3. High TF - this is a multiple of 5 higher than Mid (in this example it would be 435tick). In strong trends, the RSI of this TF will also be reaching extremes, and to me is critical in timing of turns within these strong trends.
Please see links from prior posts:
http://www.mypivots.com/forum/topic.asp?TOPIC_ID=4184
http://www.mypivots.com/forum/topic.asp?TOPIC_ID=4203
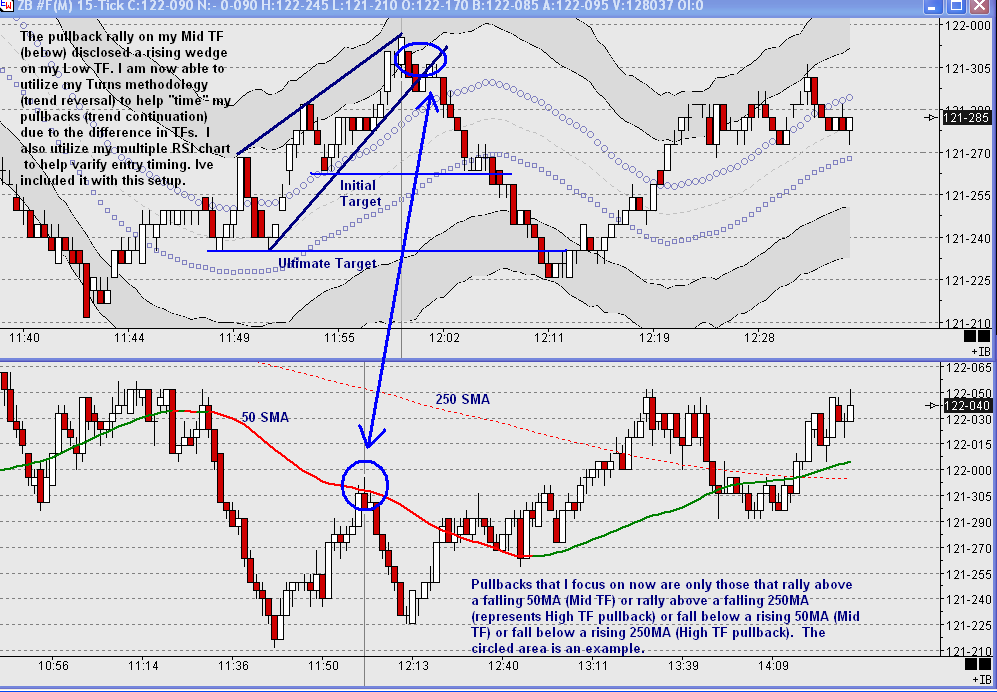
Ive also recently added pullbacks (on Mid/High TFs only) that key on the 50SMA/250SMA respectively. The following links should provide an explanation of the "Rubber Band" setup (RB), and how the RSI chart would look on Mid TF pullbacks.
http://www.mypivots.com/forum/topic.asp?TOPIC_ID=4204
http://www.mypivots.com/forum/topic.asp?TOPIC_ID=4250
http://www.mypivots.com/forum/topic.asp?TOPIC_ID=4263
http://www.mypivots.com/forum/topic.asp?TOPIC_ID=4294
Additionally, Ive attached 2 charts which highlite a recent pullback setup (Mid TF), with comments and insights. One is price (Low/Mid TFs), the other my RSI chart. After having read the above data and viewed the referenced links, I believe you will see my methodology being applied here (hopefully, lol)
Abbreviations I typically use:
TF - time frame
TL - trend line
MM - measured move
RB - rubber band (setup)
MA - moving average
I hope this helps. Im not sure what else I can add at this point. :-)
Thanks Ninja, this is great. I've been noodling thru your links and posts with this info you've provided and it's making a lot more sense to me. Good stuff!!
Hi Ninja,
Thanks for your excellent posts.
You and I have the same data feed and charting package and realizing there may be differences in data feeds, chart start times and other things, my chart's 7prd Smoothed RSI's for the same TF's are Very different from yours.
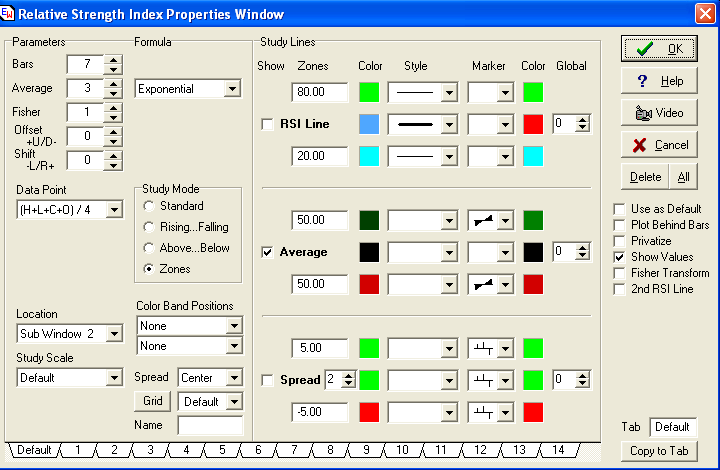
I'd like to match our charts as closely as possible, would you please take a screen shot of your Ensign RSI Properties Window and post it.
That will make it much easier to tell if we are "seeing" the same things.
Thank You
DTrader:
Ive attached a pic of my Ensign settings on my RSIs. Hope this helps. You may have noted the funky times on some of my charts. Not sure whats causing this. Some are ok, some are totally whacked. Anyway, hope this helps, and thanks for the interest.
Ive attached a pic of my Ensign settings on my RSIs. Hope this helps. You may have noted the funky times on some of my charts. Not sure whats causing this. Some are ok, some are totally whacked. Anyway, hope this helps, and thanks for the interest.
Ninja,
I can match the chart times using price so that's no problem but my RSI's are still way off from yours.
I understand the principals that you are explaining so, although I would like them to, even if the RSI's don't match, I can adapt something else.
Thanks for the quick response btw
Good Trading
I can match the chart times using price so that's no problem but my RSI's are still way off from yours.
I understand the principals that you are explaining so, although I would like them to, even if the RSI's don't match, I can adapt something else.
Thanks for the quick response btw
Good Trading
Emini Day Trading /
Daily Notes /
Forecast /
Economic Events /
Search /
Terms and Conditions /
Disclaimer /
Books /
Online Books /
Site Map /
Contact /
Privacy Policy /
Links /
About /
Day Trading Forum /
Investment Calculators /
Pivot Point Calculator /
Market Profile Generator /
Fibonacci Calculator /
Mailing List /
Advertise Here /
Articles /
Financial Terms /
Brokers /
Software /
Holidays /
Stock Split Calendar /
Mortgage Calculator /
Donate
Copyright © 2004-2023, MyPivots. All rights reserved.
Copyright © 2004-2023, MyPivots. All rights reserved.


