$VOLD
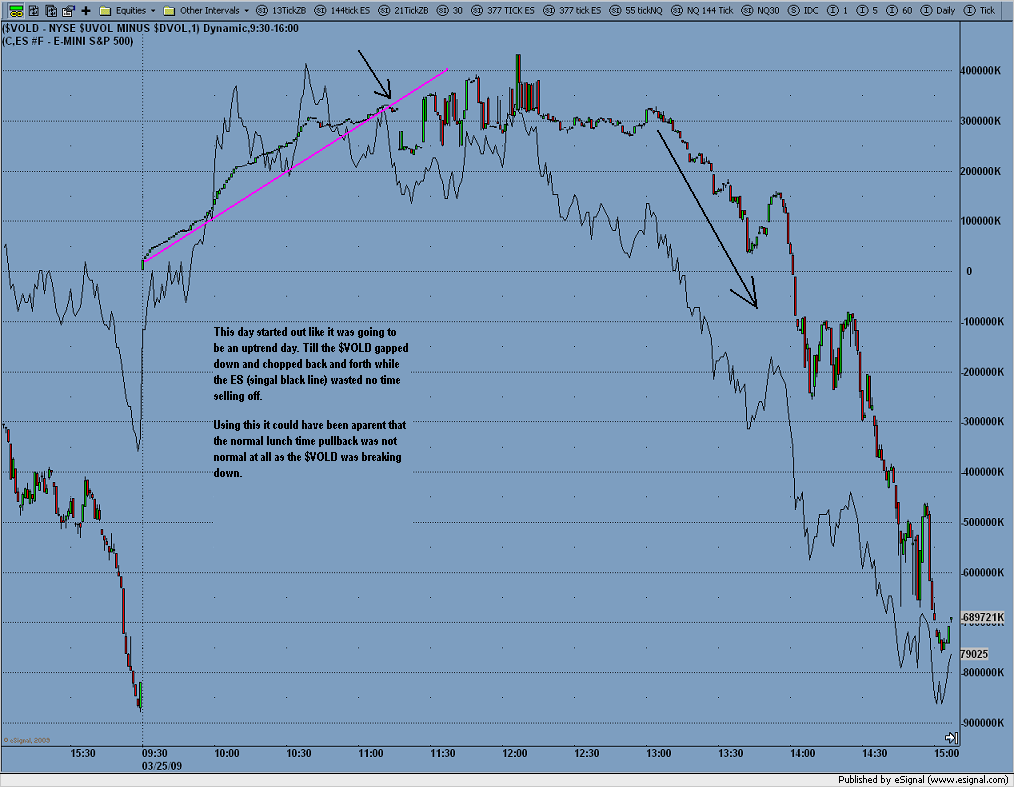
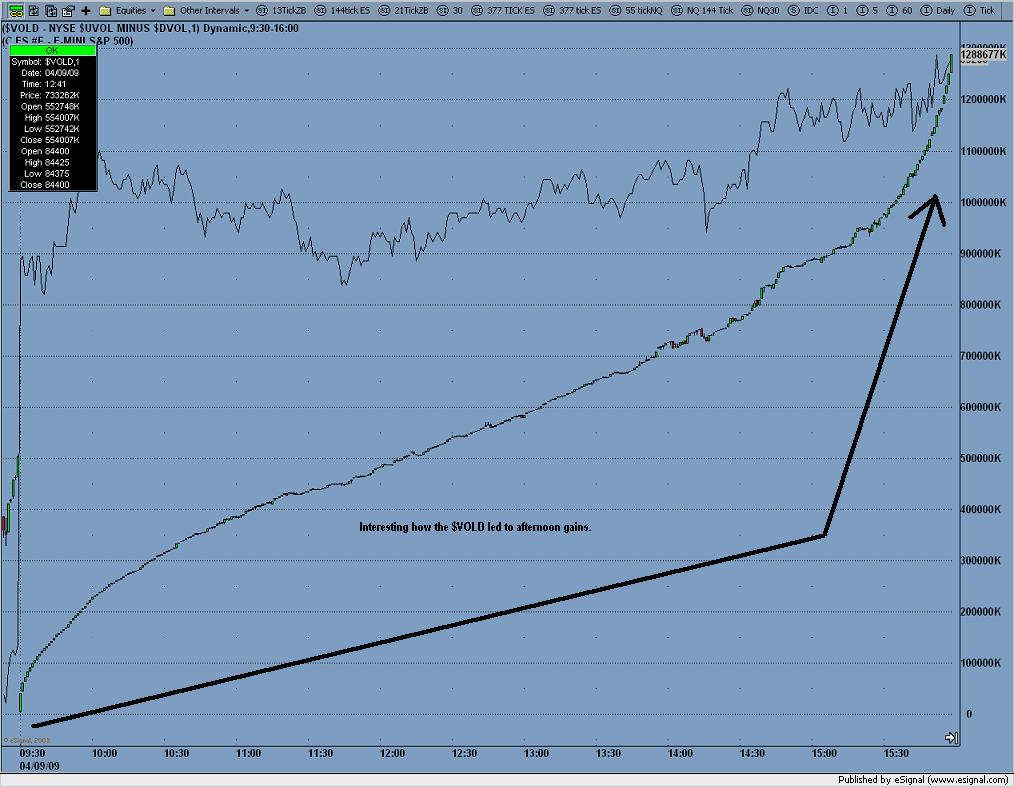
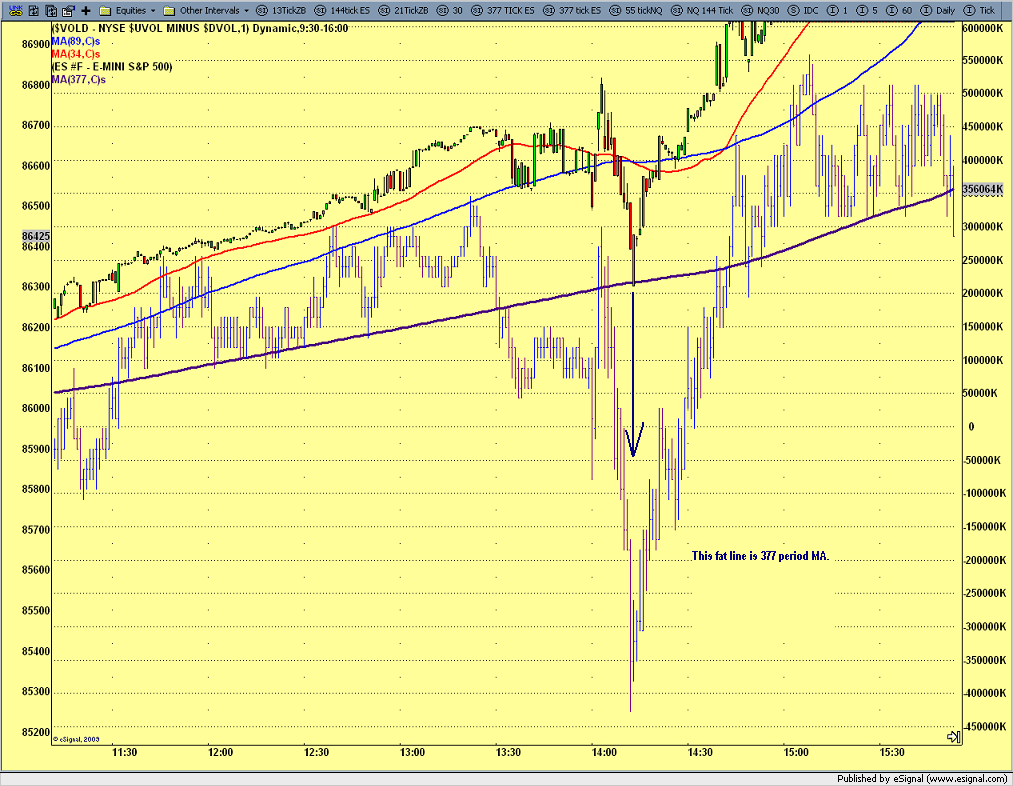
This is the NYSE up volume minus the down volume.
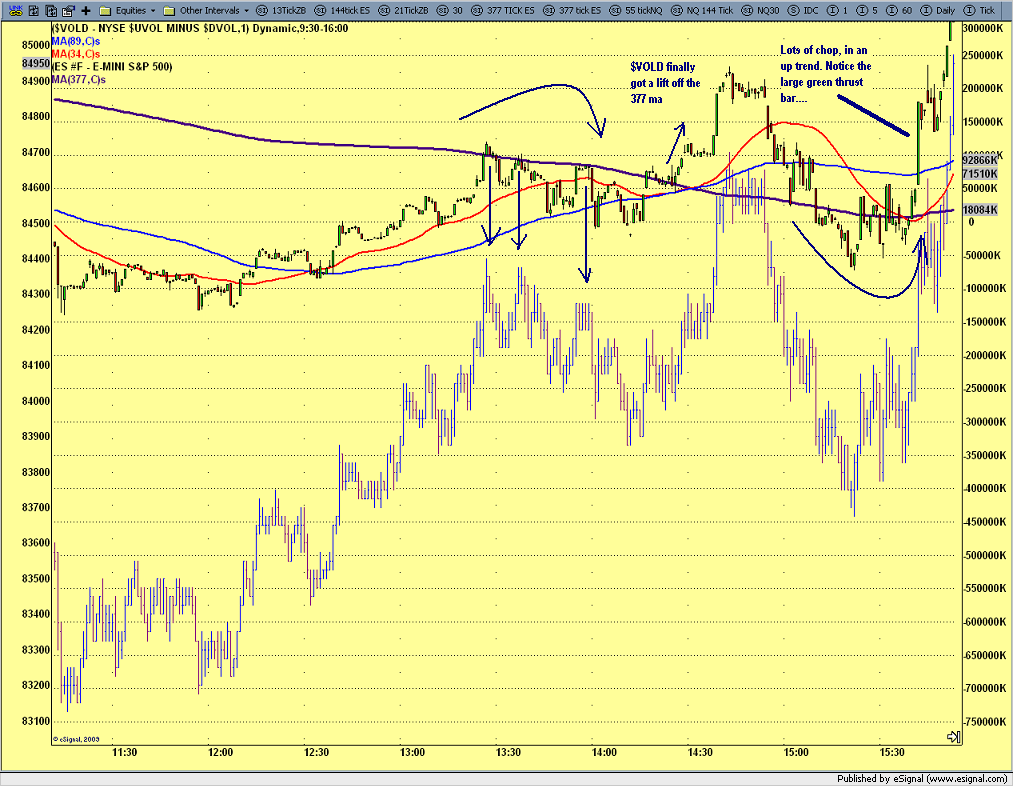
Something very interesting about this $vold, this is what trend days look like. That is very very few bars crossing the previous bars hi/lo. You can spot a trend day VERY quick with this.
The last chart is typical trend day indicator according to what I am seeing.
Something very interesting about this $vold, this is what trend days look like. That is very very few bars crossing the previous bars hi/lo. You can spot a trend day VERY quick with this.
The last chart is typical trend day indicator according to what I am seeing.
What this platform?
Thanks!
Thanks!
Its esignal, you can intergrade your trading platform thru there software. I no longer use them, I had problems with lots of data freeze. So I wouldn't use them as a stand alone. fwiw I havn't yet found a platform that I like 100% esignal was great for longer term though. I ran lots of tick charts...but normal charts wouldn't bog it down.
I contacted esignal and they said it was my computer, so I let a pro look at my computer and he said I was only running like .03% of my CPU's so it wasn't on my end.
I contacted esignal and they said it was my computer, so I let a pro look at my computer and he said I was only running like .03% of my CPU's so it wasn't on my end.
Emini Day Trading /
Daily Notes /
Forecast /
Economic Events /
Search /
Terms and Conditions /
Disclaimer /
Books /
Online Books /
Site Map /
Contact /
Privacy Policy /
Links /
About /
Day Trading Forum /
Investment Calculators /
Pivot Point Calculator /
Market Profile Generator /
Fibonacci Calculator /
Mailing List /
Advertise Here /
Articles /
Financial Terms /
Brokers /
Software /
Holidays /
Stock Split Calendar /
Mortgage Calculator /
Donate
Copyright © 2004-2023, MyPivots. All rights reserved.
Copyright © 2004-2023, MyPivots. All rights reserved.


