Chart requested ??
This may be asking a lot.......can anyone post a chart of the S&P emini with the Up and down NYSE volume ratio overlaid as a line chart. Specifically 30 minute data and thresholds of 80% and 20 %. Can esignal accomodate this?
The dow was up almost .5 % greater than the S&P and the Naz today.....an obvious concern for me
Thanks
Bruce
The dow was up almost .5 % greater than the S&P and the Naz today.....an obvious concern for me
Thanks
Bruce
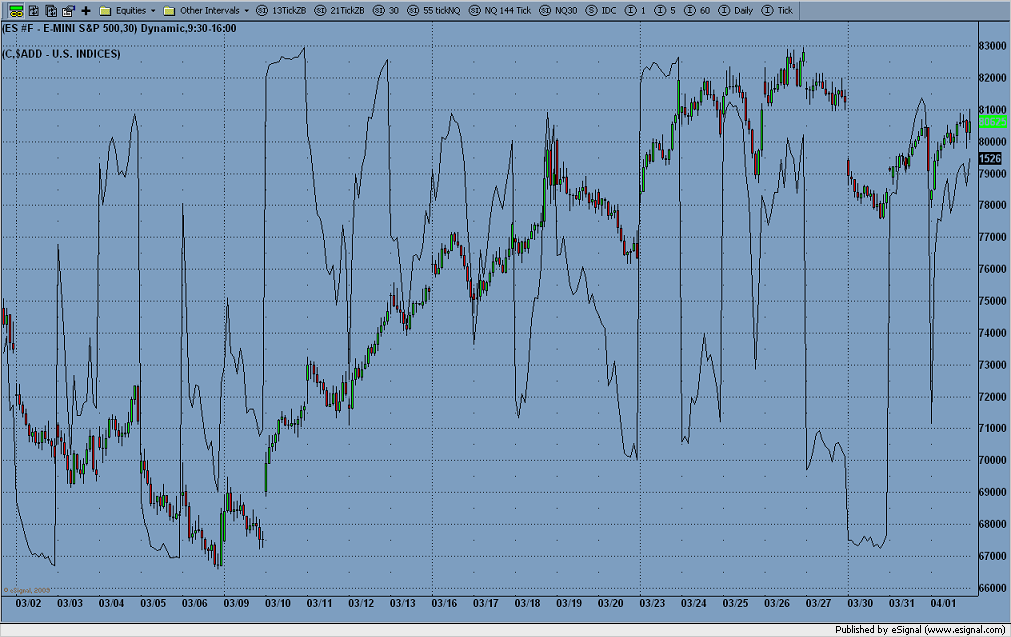
Here is a chart with the $ADD on a 30min chart.
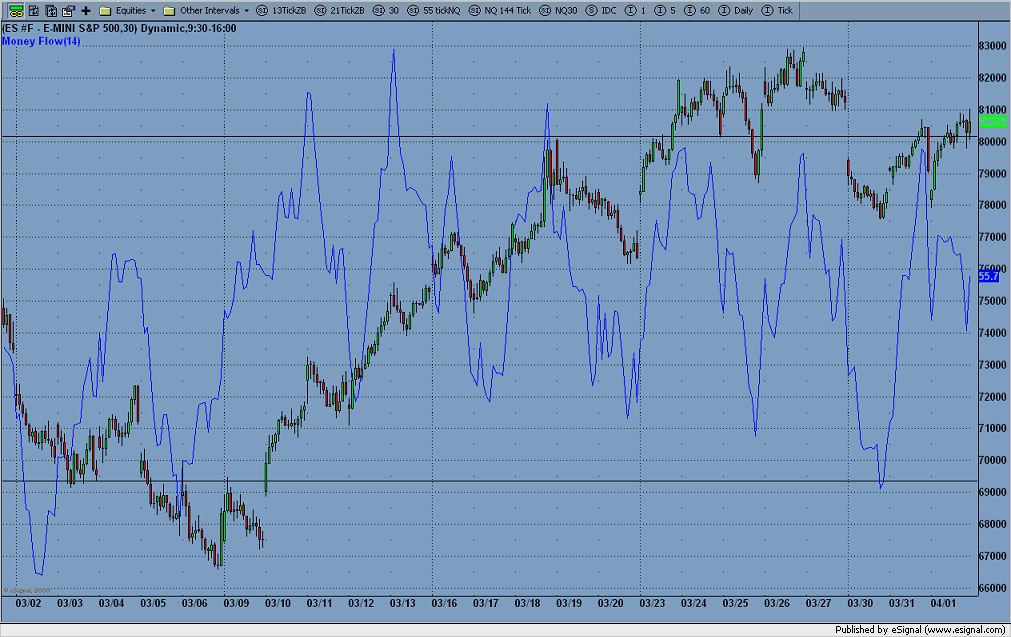
Here is a chart with money flow which is a fenced indicator from 0-100. If this is not what you are looking for just expalin
Here is a chart with money flow which is a fenced indicator from 0-100. If this is not what you are looking for just expalin
I'm not sure Joe...here is the formula
(Up volume/(up volume + down Volume)) * 100
a reading above 80 is very strong buyers and below 20 is very strong sellers...perhaps your money flow is showing the same thing...thom hartle has written about it...the JPJ folks call it $vold I believe..( also known as the Chester)
(Up volume/(up volume + down Volume)) * 100
a reading above 80 is very strong buyers and below 20 is very strong sellers...perhaps your money flow is showing the same thing...thom hartle has written about it...the JPJ folks call it $vold I believe..( also known as the Chester)
Looks like an interesting formula, Bruce. I tried for about 2hrs to get something going and couldn't I am better with trade station. I am going to have open an account with them because I have a half of a dozen other things I really want to write. If anyone out there nows how to write it for e-signal I would be much obliged.
Emini Day Trading /
Daily Notes /
Forecast /
Economic Events /
Search /
Terms and Conditions /
Disclaimer /
Books /
Online Books /
Site Map /
Contact /
Privacy Policy /
Links /
About /
Day Trading Forum /
Investment Calculators /
Pivot Point Calculator /
Market Profile Generator /
Fibonacci Calculator /
Mailing List /
Advertise Here /
Articles /
Financial Terms /
Brokers /
Software /
Holidays /
Stock Split Calendar /
Mortgage Calculator /
Donate
Copyright © 2004-2023, MyPivots. All rights reserved.
Copyright © 2004-2023, MyPivots. All rights reserved.

