Anybody selling 789 - 790 ?
c'mon and join my drawdown.......interesting overnight....what's all this about? they have to test 80.50 for me
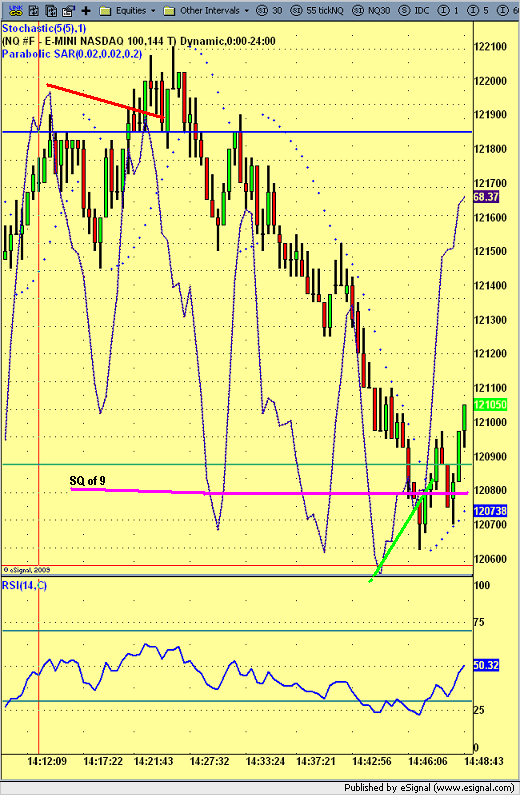
Covered NQ @ 1211
Here is a chart of what I am looking at in case anyone new is watching...I look for a number of divergence's on MACD 55 ticks, stochastics 144 ticks, and the RSI has to be overbalnced on the 55 ticks. Although this trade I didn't have a macd div. I did have a 144 div. and oversold RSI with a nice tight SAR on the 55tick chart. My stop was only 5ticks
I don't mind posting charts, I have a photo journal I keep of all my trades, well most trades.
I am getting some almost oversold readings on the RSI 30 min of 31.92 something so almost oversold. Covered all but 2 of those ES shorts. At 789...I am tired of holding overnight. Stop on rest @ 815
Interesting how it faked the longs by going over the weekly IB before selling off.
thanks for taking the time with the charts Joe. Sometimes I feel that very few people are here at the forum but it is very helpful to have an online "journal" of concepts and ideas so it's not a wasted effort.....
double tpo's on the lows for the ES and a hour high breakout in YM only....look at the great close cluster on 30 minute bars from yesterday...that is the key for today...goes well with our high volume numbers
bell shaped volume profile still.....but for how long...still looking to see the rallies until proven wrong...problem for me here is that a plus or minue 8- 10 point range will expand off open price......so better sells would be up in 25 - 29.....all markets breaking out of highs as I type so we need a change of trend signal
weekly R2 level at 826 probably helped us out a bit up here too.....sometimes we never know "WHY" an area is important on the chart but the Volume can't hide from us..I'm trying to hold this for those double TPo's on the lows........hard part of this trade is knowing that yesterday traded on both sides of the 60 minute range so I'm not sure if it is wise to expect it to happen today...we have the lowest range 15 minute bar near the VWAP so that is an obvious hurdle too as it was the close cluster and high volume from yesterday
I got another short @ 823.5
MACD, and Stochastics div. on the NQ I am short them @ 1272, watching the SAR for exit (55 tick) took me out @ the SAR as I was typing 1268.5
Avg on the ES is now 826 thats the last time I am adding to "this" up market....I will add if it breaks down, if not I am just getting out.
No NK, It stalled to long for my liking so I bailed wends for 25 points instead. The market was a lot stronger than I thought it was, I was lucky to get that I was down 7k...
Emini Day Trading /
Daily Notes /
Forecast /
Economic Events /
Search /
Terms and Conditions /
Disclaimer /
Books /
Online Books /
Site Map /
Contact /
Privacy Policy /
Links /
About /
Day Trading Forum /
Investment Calculators /
Pivot Point Calculator /
Market Profile Generator /
Fibonacci Calculator /
Mailing List /
Advertise Here /
Articles /
Financial Terms /
Brokers /
Software /
Holidays /
Stock Split Calendar /
Mortgage Calculator /
Donate
Copyright © 2004-2023, MyPivots. All rights reserved.
Copyright © 2004-2023, MyPivots. All rights reserved.
