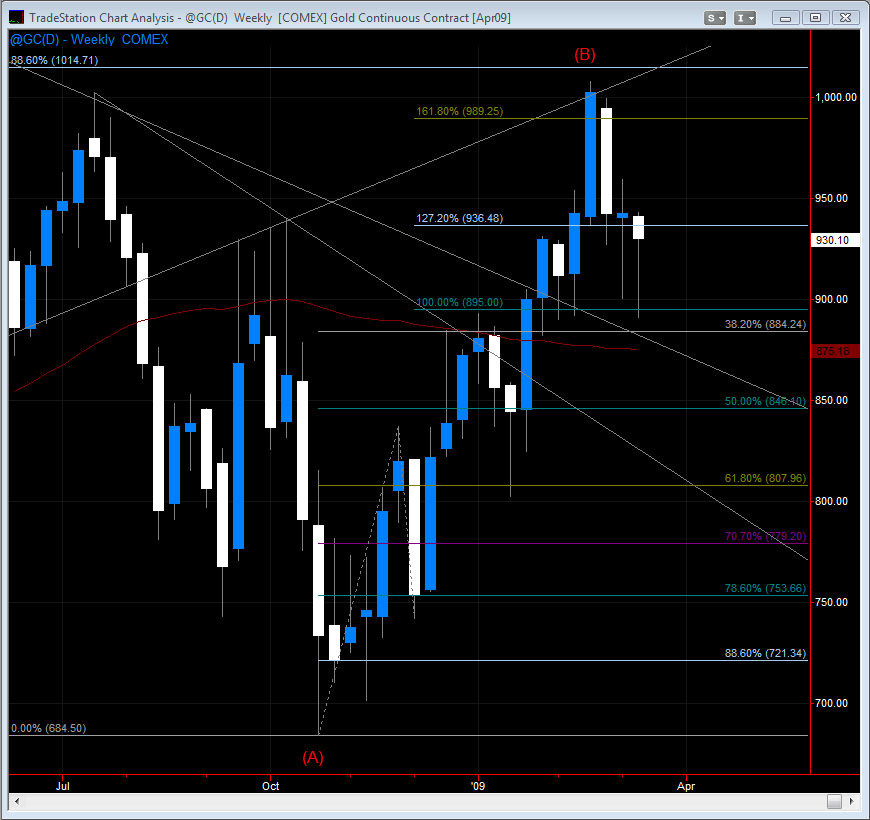
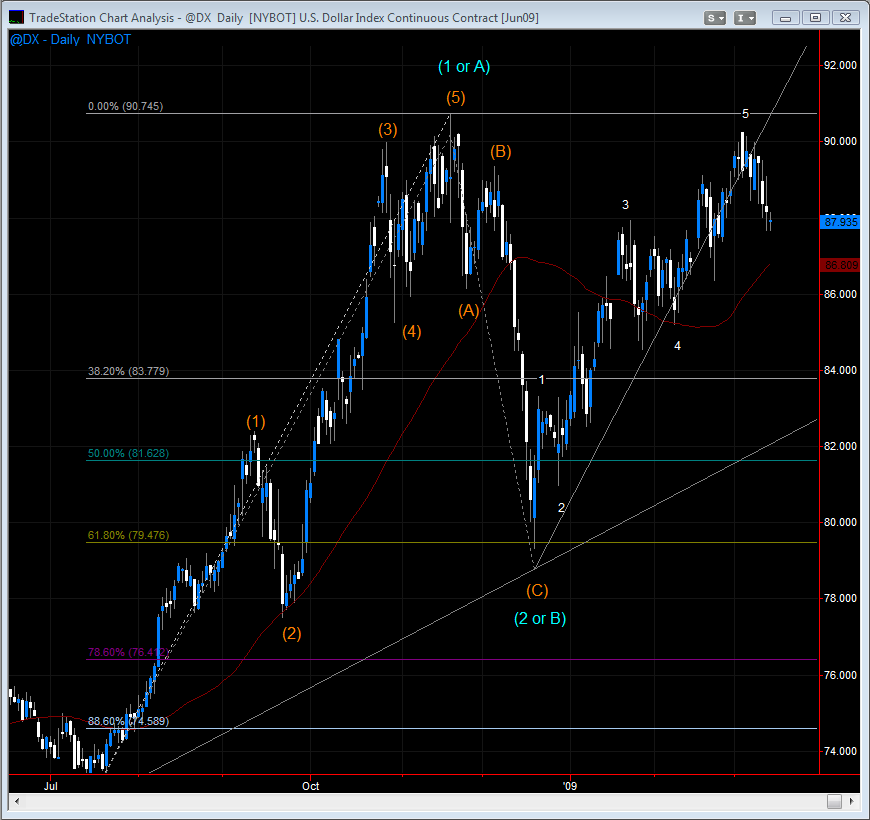
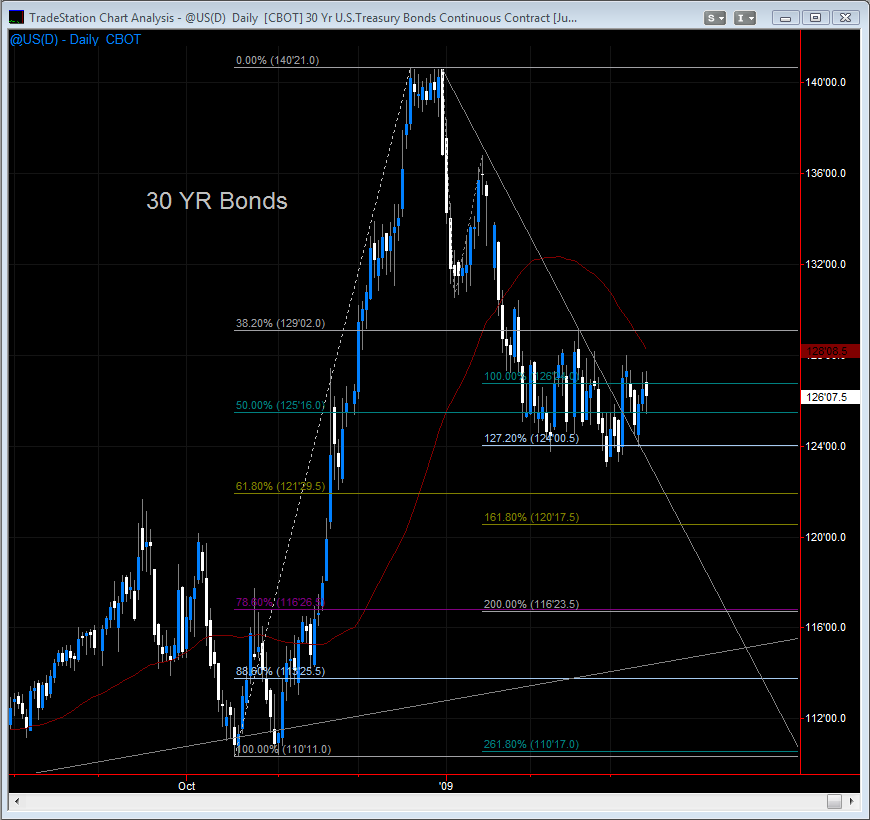
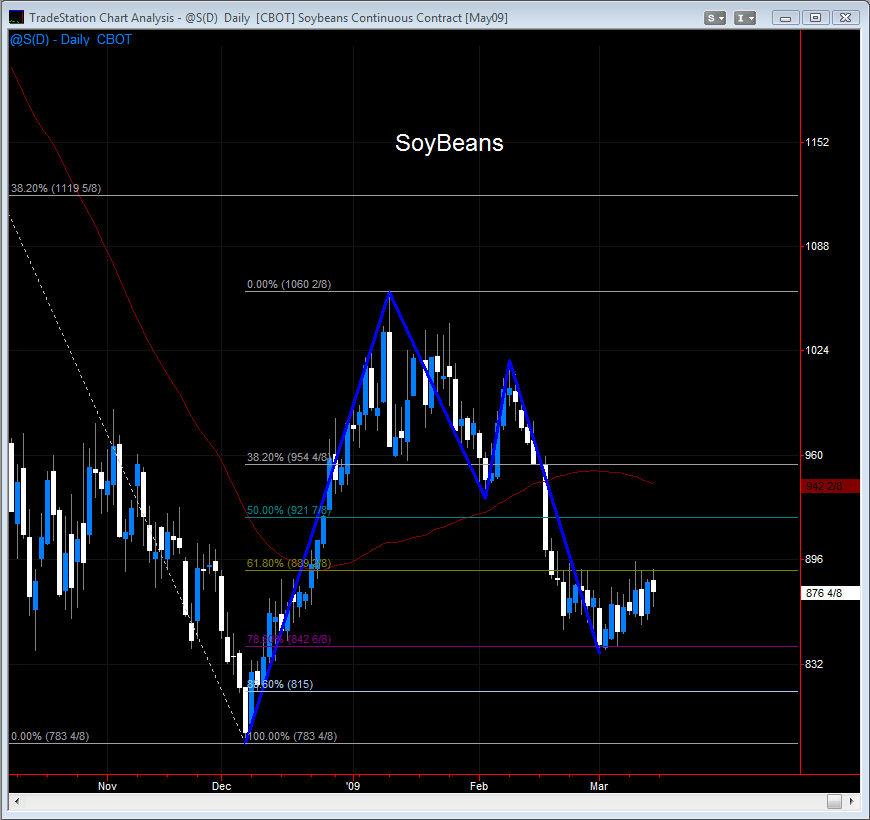
Weekend Chart Summary 3-14-09
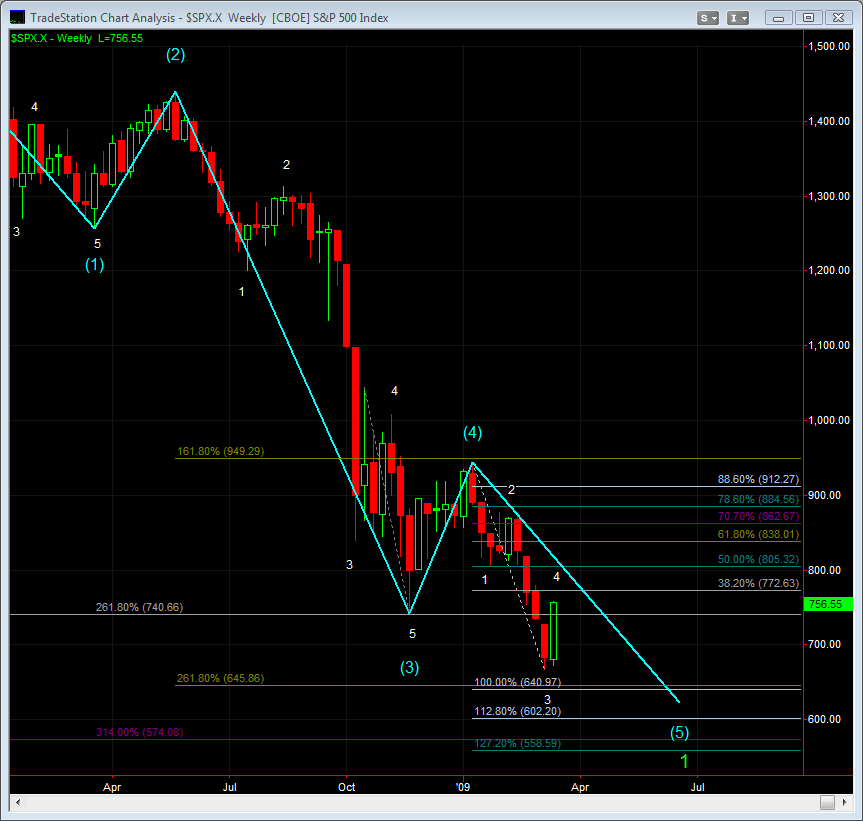
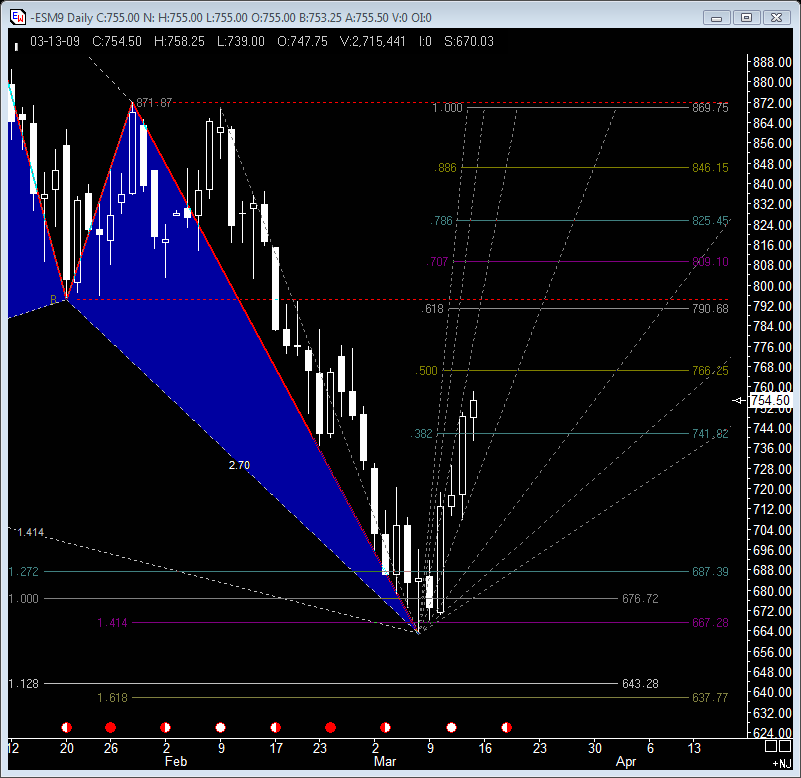
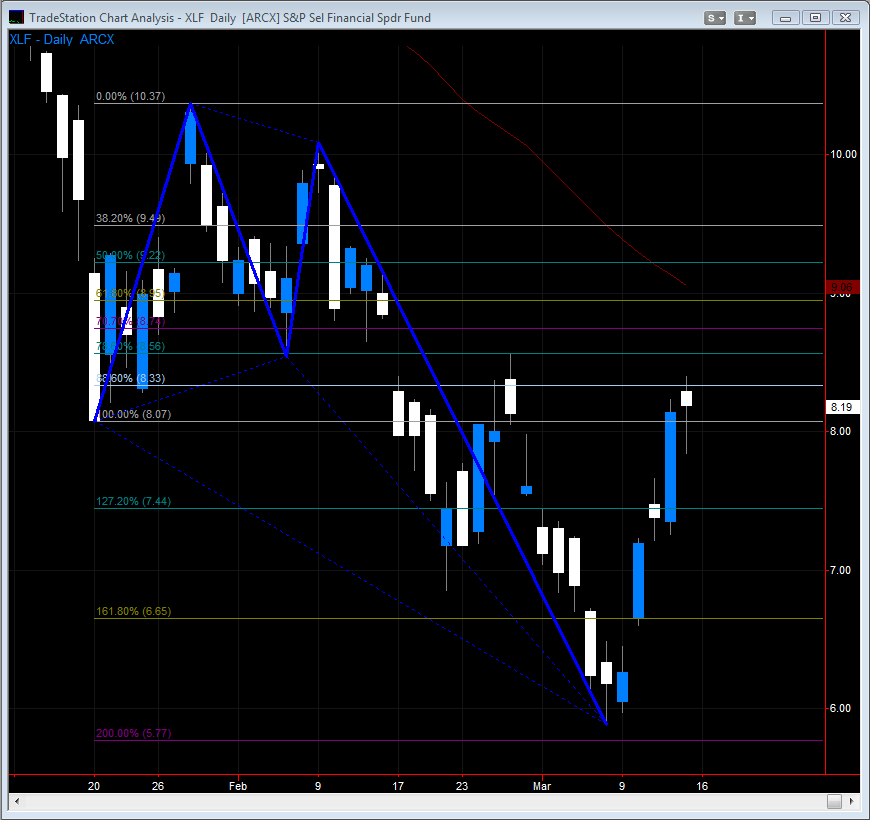
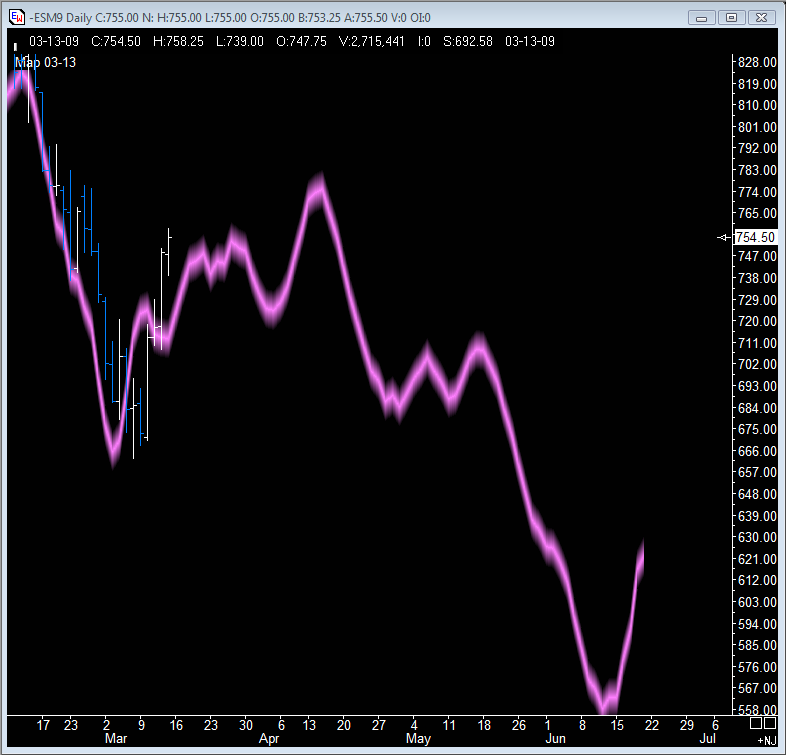
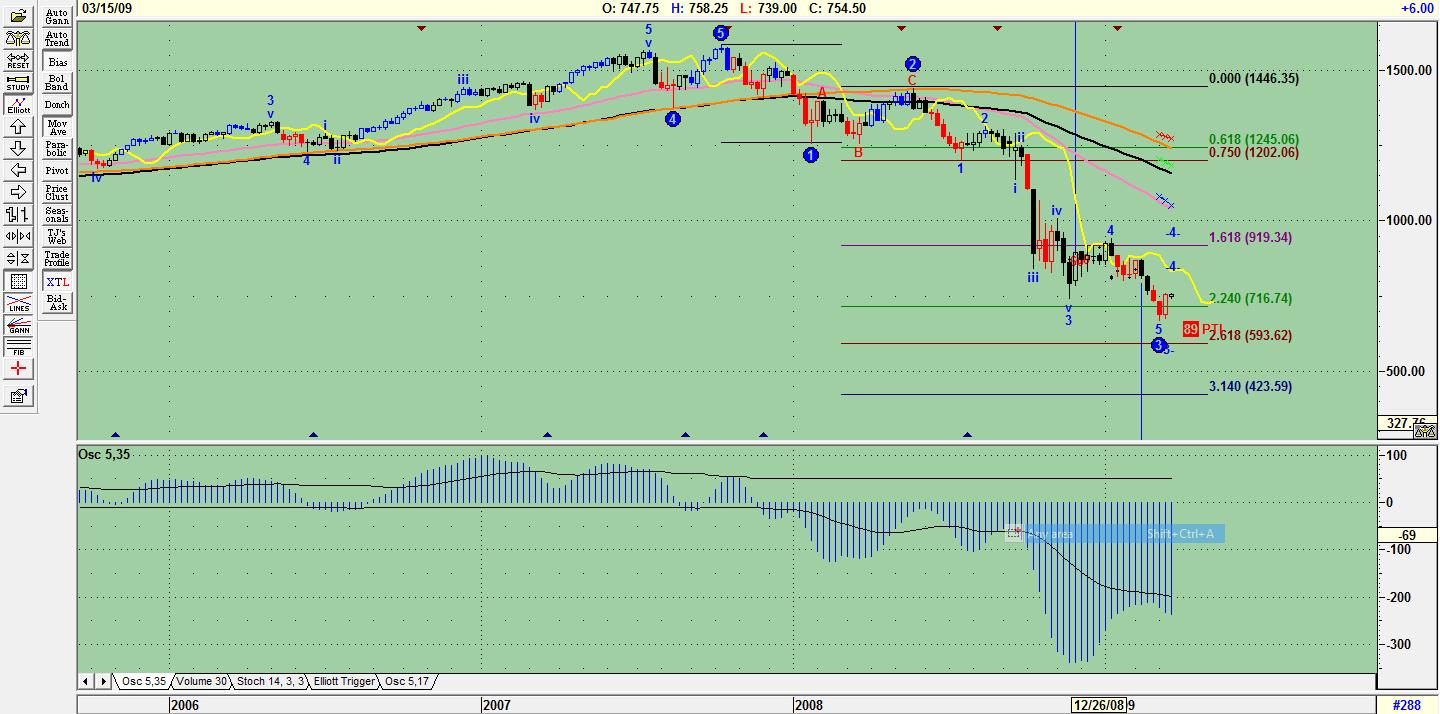
VO - What exactly is that first chart?????- what is that purple line projecting way out to June?
quote:
Originally posted by palmer
VO - What exactly is that first chart?????- what is that purple line projecting way out to June?
That is the Ensign map forecast applied to the daily chart.
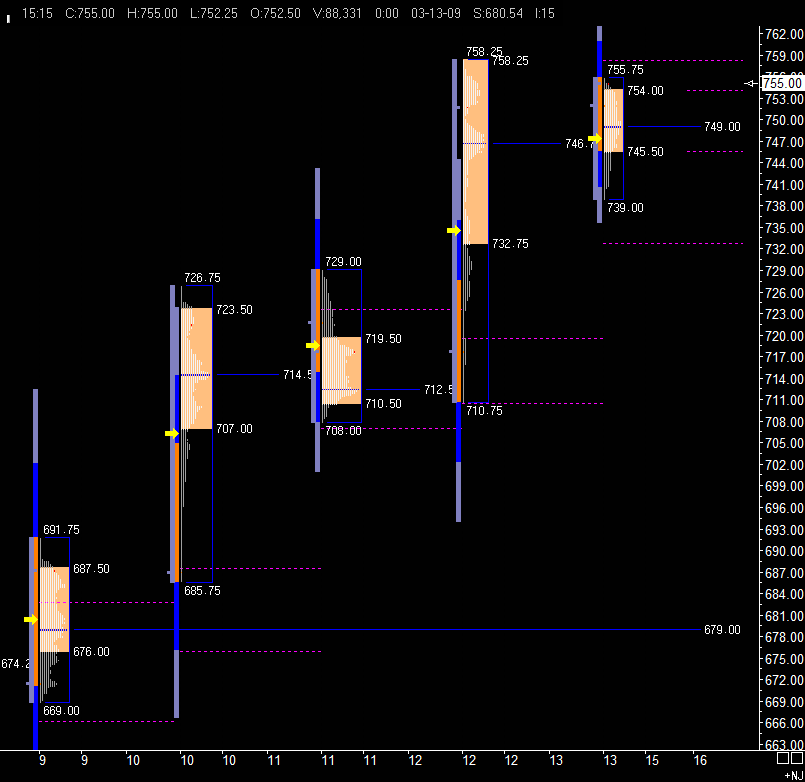
Weekly DeMark Pivot @ 737.75
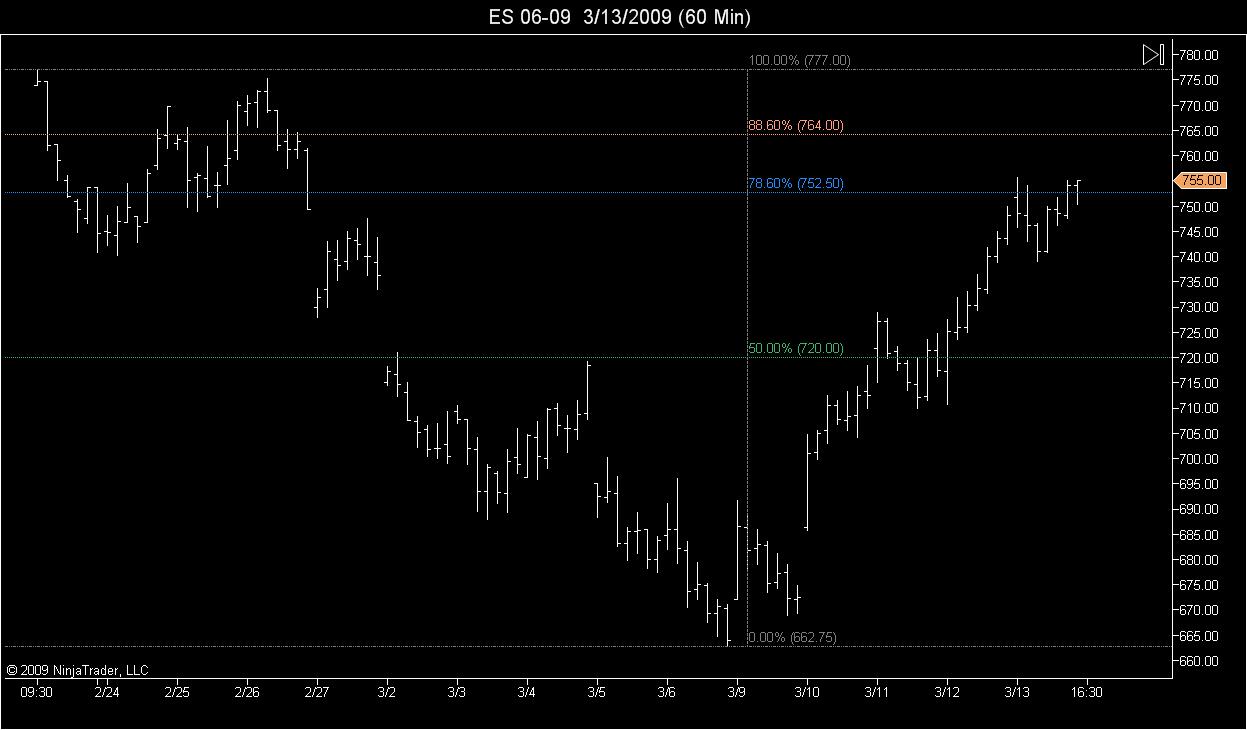
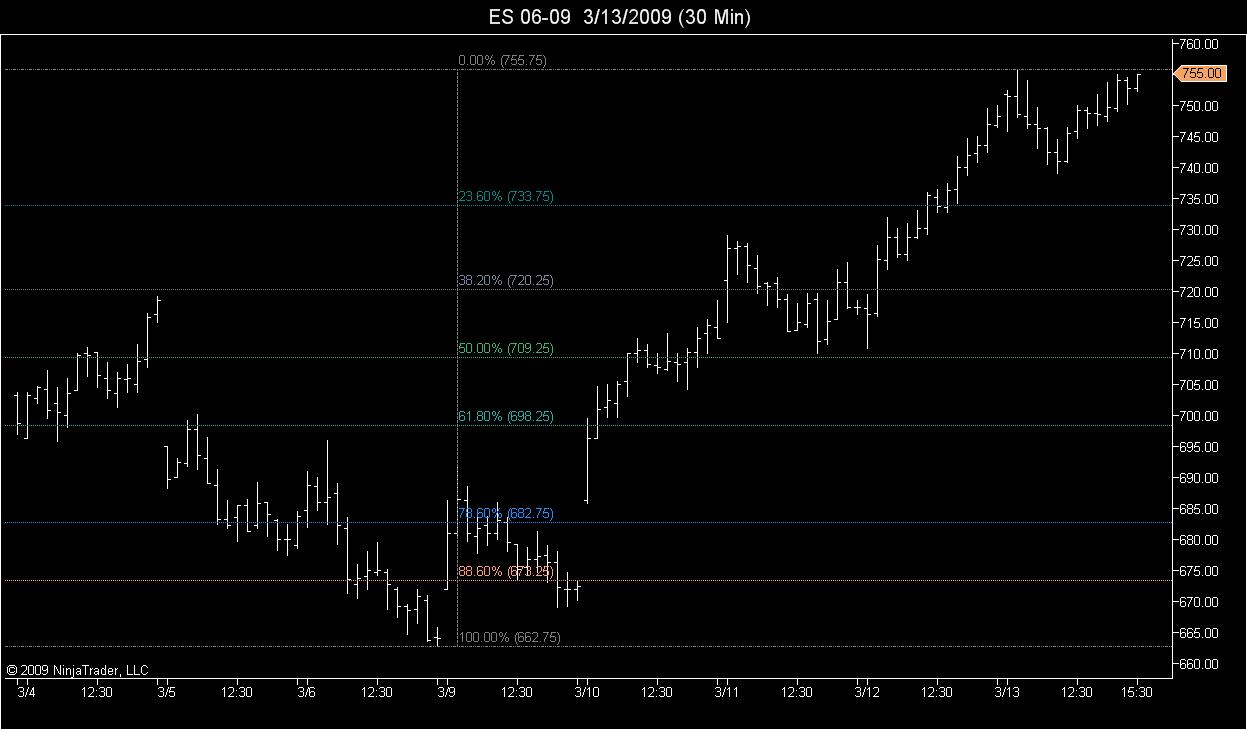
High Ticks: 766.50 - 70.00 = 696.50
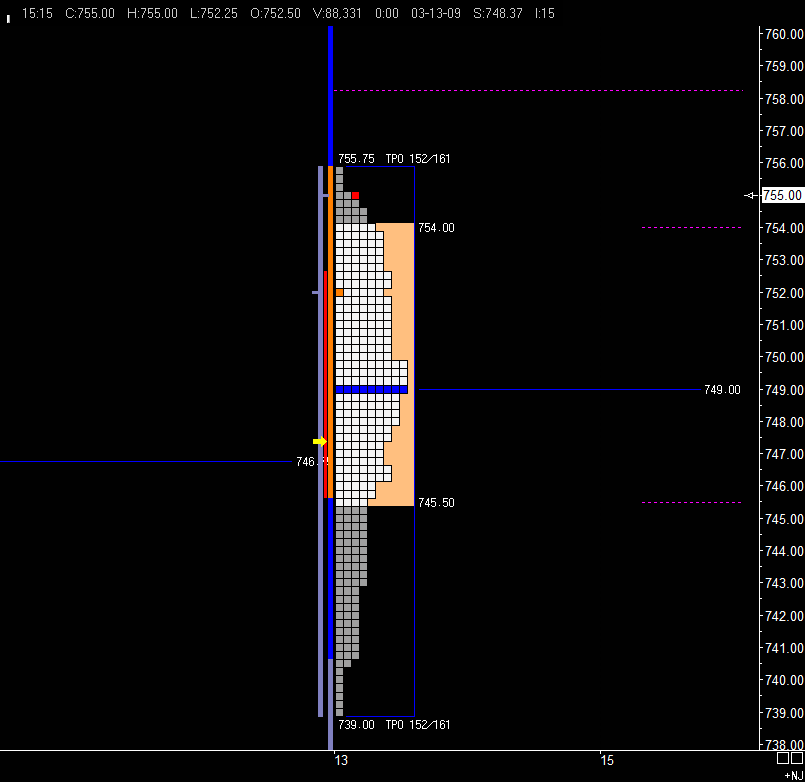
Friday was the narrowest range day in the past 21 trading days.
High Ticks: 766.50 - 70.00 = 696.50
Friday was the narrowest range day in the past 21 trading days.
Great charts and info. Thanks everyone!
Jack,
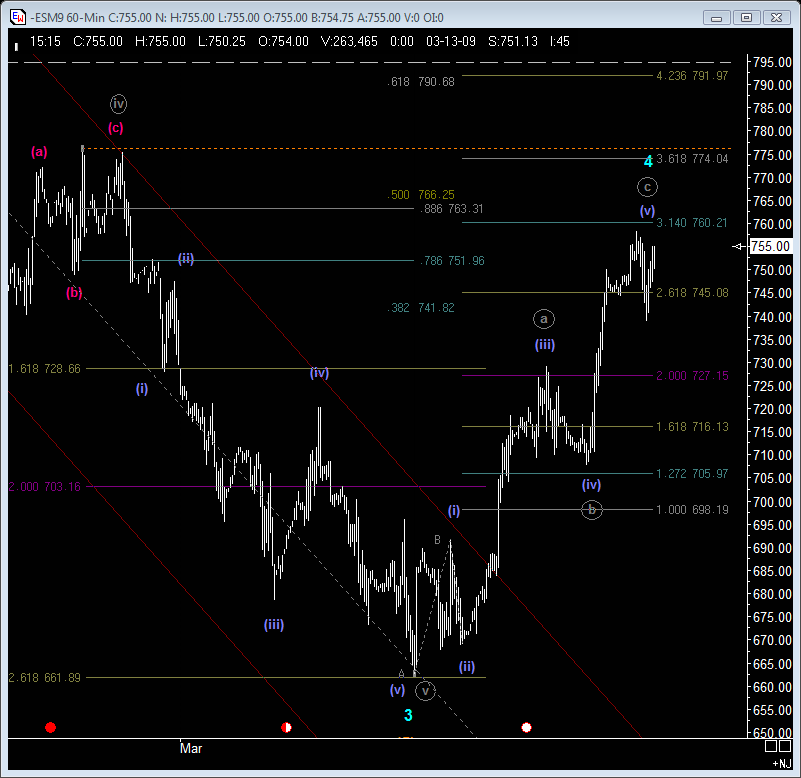
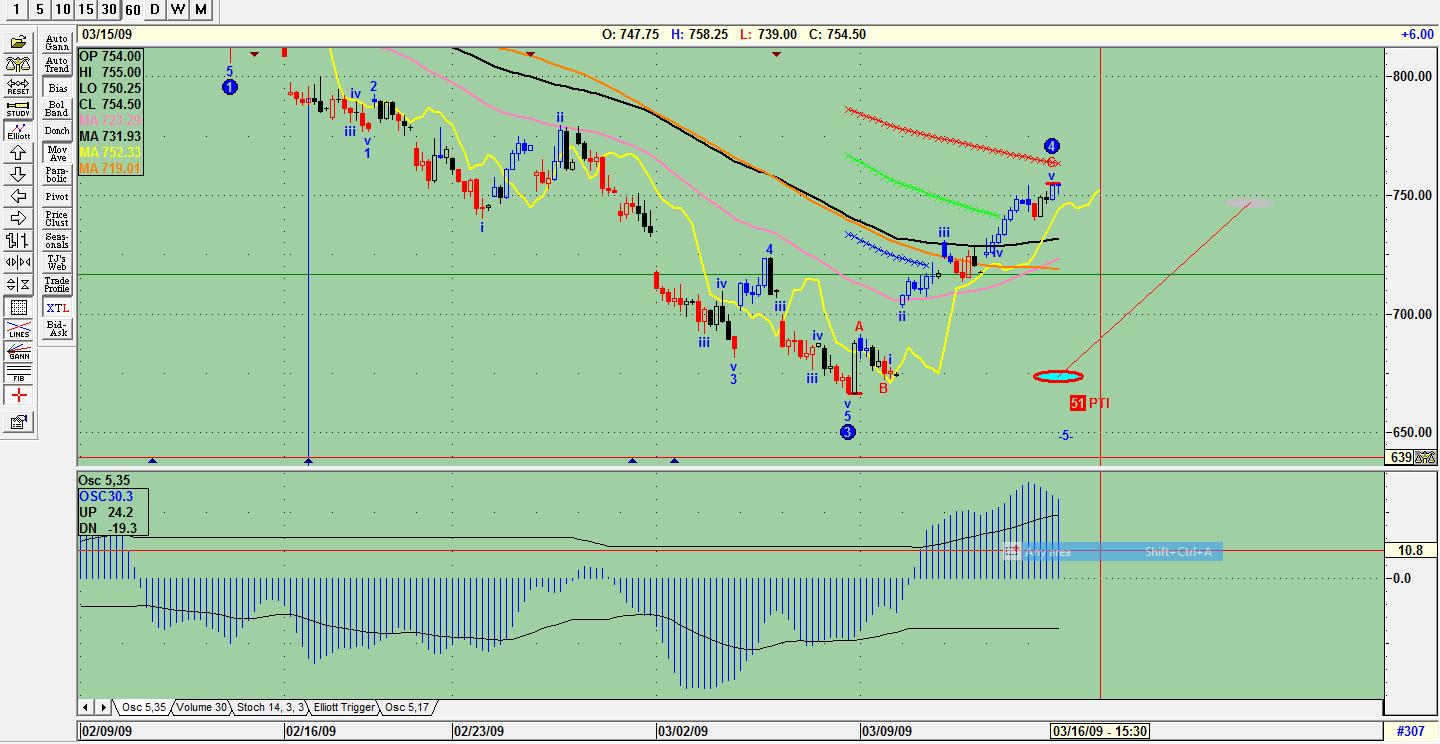
I am by no means an Elliot wave expert. But in that 60 min chart it had v, C, and 4 waves at Fridays high thats calling for a smaller ABC correction right?
I am by no means an Elliot wave expert. But in that 60 min chart it had v, C, and 4 waves at Fridays high thats calling for a smaller ABC correction right?
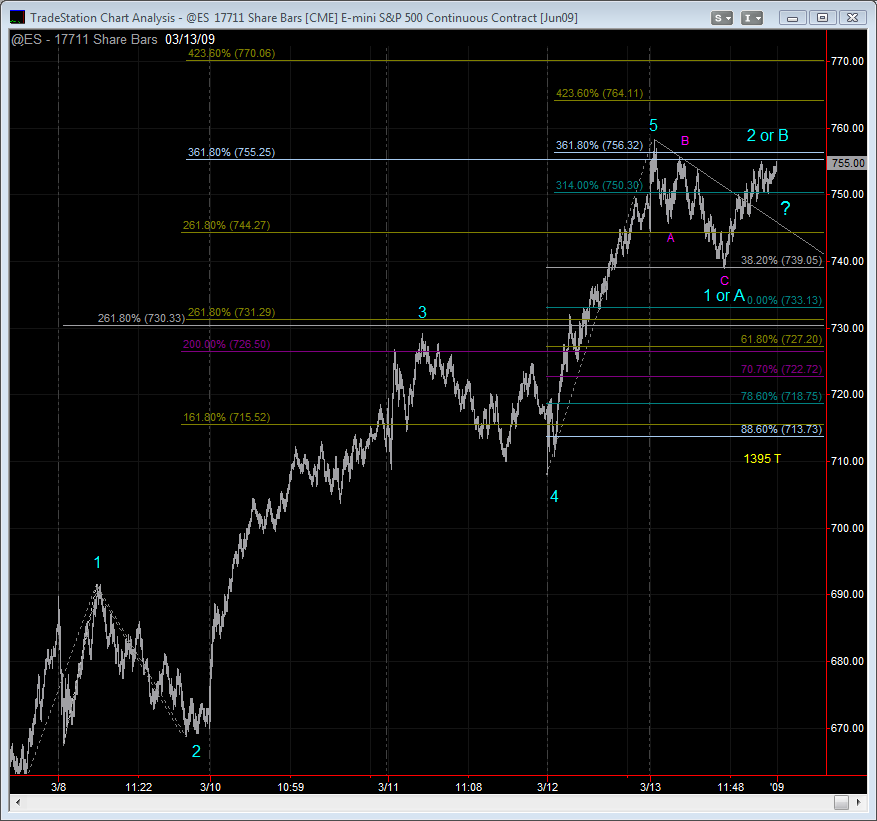
Joe, we are indeed in v of 4 and C. Jack uses pit session and can make it tuff to interpret (for instance it shows ii above i and we know that cant be the case). You can tell advget factors in the data not shown (I think). When those are complete we should begin 5 down. As a rule wave 4 never enters the price territory of wave 1. For the M contract wave 1's low is 794.75, which is denoted by a thick grey dashed line on my 60m chart. Also, a guideline (not rule) of a three wave correction (ABC) usually terminates within the price territory of the previous fourth wave of one lesser degree. Again for the M contract that high would be 775.25, which I have as a orange dotted line. So, bottom line is that we are very close (maybe there based on globex open) to starting our wave 5 down, which should take out the wave 3 low of 662.75 (M contract). 5th waves don't have to take out lows or highs...they can be truncated, but thats not the norm. I am no expert either Joe, however, I do have a working knowledge of Ewaves. I know your short from a previous post and you probably have nothing to worry about - is my qualified guess.
Jack what I find interesting in the weekly is that advget is hedging wave 4. I assume they changed this due to the strength of our last weekly candle. I have seen this from several other sources. It would be a shame if indeed we are still in a big ol' complex wave 4 correction. I would just assume we get on with 5 and make some hellish lows to scare the bejesus out of everyone and then we can have a layup rally. Sigh...if only it were that easy. Jack as always I appreciate you sharing the charts.
Emini Day Trading /
Daily Notes /
Forecast /
Economic Events /
Search /
Terms and Conditions /
Disclaimer /
Books /
Online Books /
Site Map /
Contact /
Privacy Policy /
Links /
About /
Day Trading Forum /
Investment Calculators /
Pivot Point Calculator /
Market Profile Generator /
Fibonacci Calculator /
Mailing List /
Advertise Here /
Articles /
Financial Terms /
Brokers /
Software /
Holidays /
Stock Split Calendar /
Mortgage Calculator /
Donate
Copyright © 2004-2023, MyPivots. All rights reserved.
Copyright © 2004-2023, MyPivots. All rights reserved.
